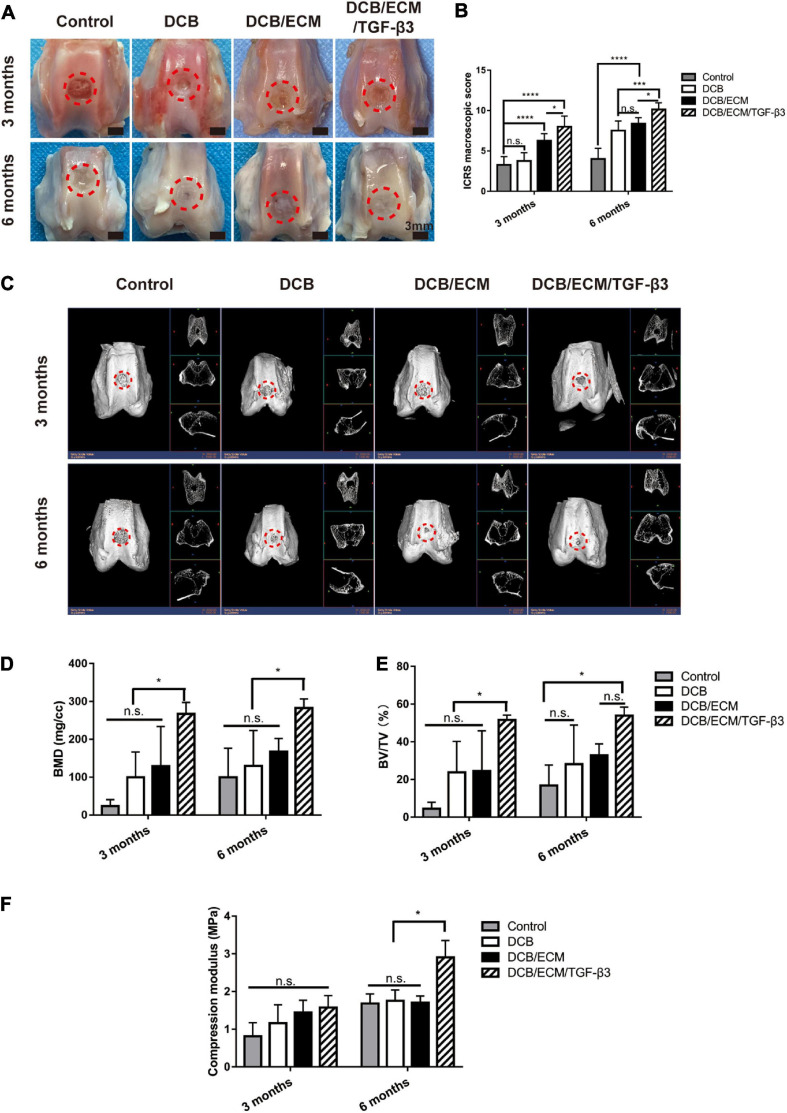
FIGURE 6.
Representative macroscopic, radiological and biomechanical properties of repaired tissues at 3 and 6 months postoperation. (A) Representative macroscopy. (B) ICRS scores at 3 and 6 months. (C) Representative 3D and 2D micro-CT images at each time point. Quantitative analysis of (D) BMD and (E) BV/TV (n = 6 knees). The repaired sites were indicated by red circles. (F) Compression modulus of repaired tissues at 3 and 6 months (n = 3 knees). The red circles indicate the repaired areas. Data are means ± SDs (*p < 0.05, ***p < 0.005, ****p < 0.001, n.s. represents no significant difference).

