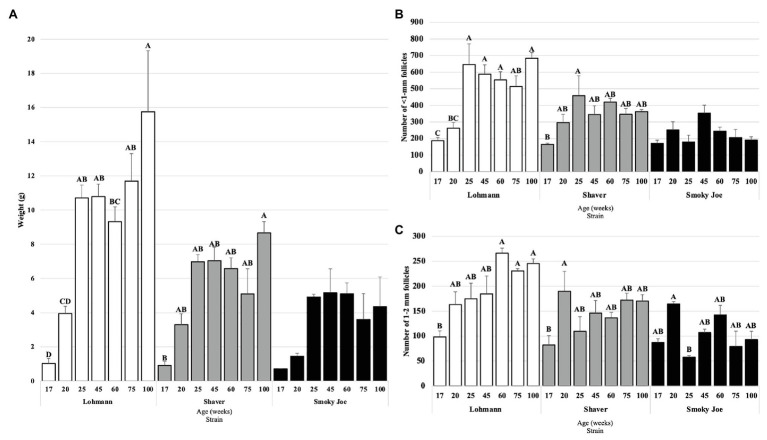
Figure 5.
Ovary weight (A), as well as the number of <1-mm (B) and 1–2 mm follicles (C) in Lohmann, Shaver, and Smoky Joe hens at 17, 20, 25, 45, 60, 75, and 100 woa. (A) p-values for the sources of variation: Age, p < 0.0001; Strain, p < 0.0001; and Age*Strain, p = 0.0071 (B) Age, p < 0.0001; Strain, p < 0.0001; and Age*Strain, p = 0.0003. (C) Age, p < 0.0001; Strain, p < 0.0001; and Age*Strain, p = 0.0007. A,B,C,DData points lacking the common superscript differ significantly within the ages of each strain, while no superscript indicates no difference from any other time point in that strain.

