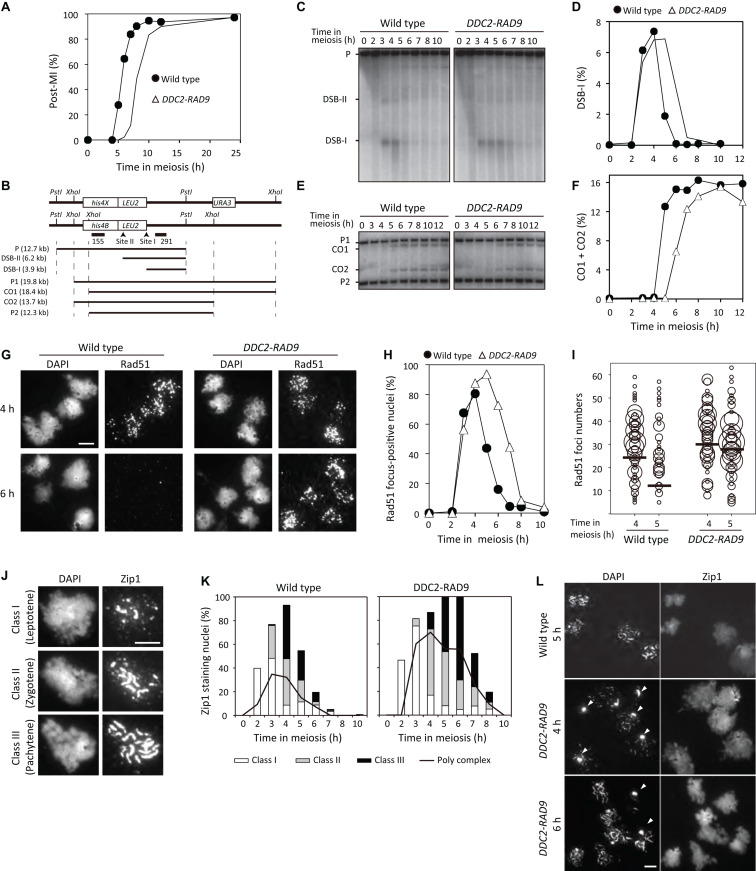
FIGURE 5.
DDC2-RAD9 impedes cell cycle progression and meiotic recombination. (A) Meiotic nuclear divisions were monitored in wild-type (USY543/544) and DDC2-RAD9 (USY544/671) strains by DAPI staining. The y-axis represents the percentage of cells that completed meiosis I and II (Post-MI). At least 200 cells were counted at each time point. (B) Schematic presentation of the HIS4-LEU2 DSB site. (C,E) Genomic DNAs were prepared from the indicated strains during the meiotic time course. Meiotic DSBs (DSB-I and DSB-II) (C) or crossover recombinants (CO1 and CO2) (E) were detected by Southern blot using the probes pNK291 or pNKY155 after genomic DSBs were digested with PstI or XhoI, respectively. (D,F) Quantitative data of DSB-I (C) and CO1 + CO2 (E) obtained from Southern blot are plotted. (G–L) DDC2-RAD9 influences localization of Rad51 and Zip1 on meiotic chromosome. (G) The representative images of Rad51 immunostaining nuclear foci in spread nuclei prepared from the indicated strains at 4 and 6 h in meiosis are shown. (H) The percentage of the indicated cells’ nuclei that had more than 5 Rad51 foci was plotted at the indicated time points. (I) Distribution of nuclei according to Rad51 foci number per nucleus at the indicated time is presented using the same data samples as in (H). Only nuclei that had more than 5 Rad51 foci were plotted. The size of the bubbles reflects the percentage of nuclei that had a certain foci number of Rad51 among all nuclei examined. Bars represent the average numbers of Rad51 foci. (J) Representative images of Zip1 staining classification are shown. (K) Classifications of Zip1 staining at the indicated time in the indicated strains are shown. The line represents the Zip1 polycomplex (PC). At least 100 nuclei were examined at each time point. (L) Representative images of Zip1 staining in DDC2-RAD9 at 4 h and 6 h are shown. Zip1 PCs are indicated by arrowheads. Experiments were performed at least twice, and representative data are shown. Bar equals 5 μm.

