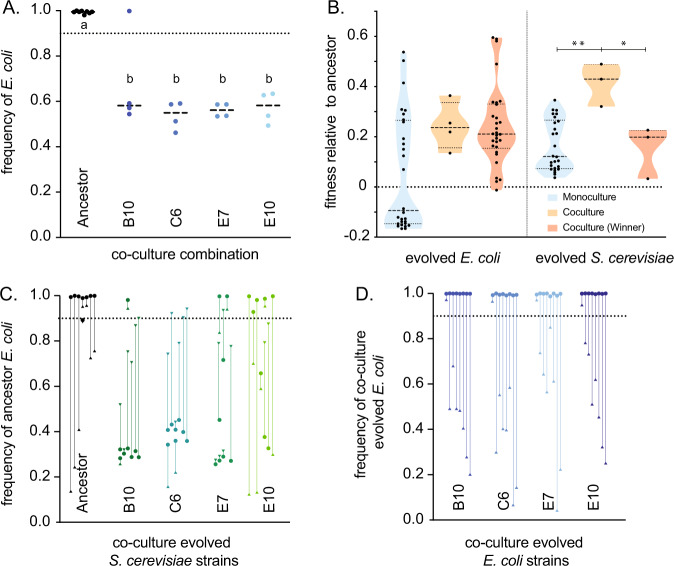
Fig. 2. The evolution of stable E. coli - S. cerevisiae co-cultures.
A The equilibrium frequency of S. cerevisiae and E. coli co-culture for ancestral (black dots) and co-culture evolved strains (coloured dots) expressed as the frequency of E. coli (fE. coli). B The fitness of evolved monoculture populations (blue), populations that persisted in co-culture for 980 generations (orange), and “winners”, populations that outcompeted its opposite species in co-culture during the second phase (generation 420–980) of the evolution experiment. E. coli strains are shown in the left panel and S. cerevisiae shown on the right panel. Stars show significant differences between individual comparisons using Bonferroni-corrected Mann–Whitney U tests. C The final equilibrium frequency of ancestral E. coli co-cultured with ancestor and co-culture evolved S. cerevisiae populations after an invasion assay; and D ancestral S. cerevisiae with co-culture evolved E. coli. An equilibrium frequency of “1” means that E. coli has driven S. cerevisiae extinct, and 0.5 means that E. coli and S. cerevisiae are equally represented in stable co-culture. Arrows start at the inoculation frequency for each of the replicate populations. Capitalised letters show different groups as designated by Tukey’s post-hoc test.

