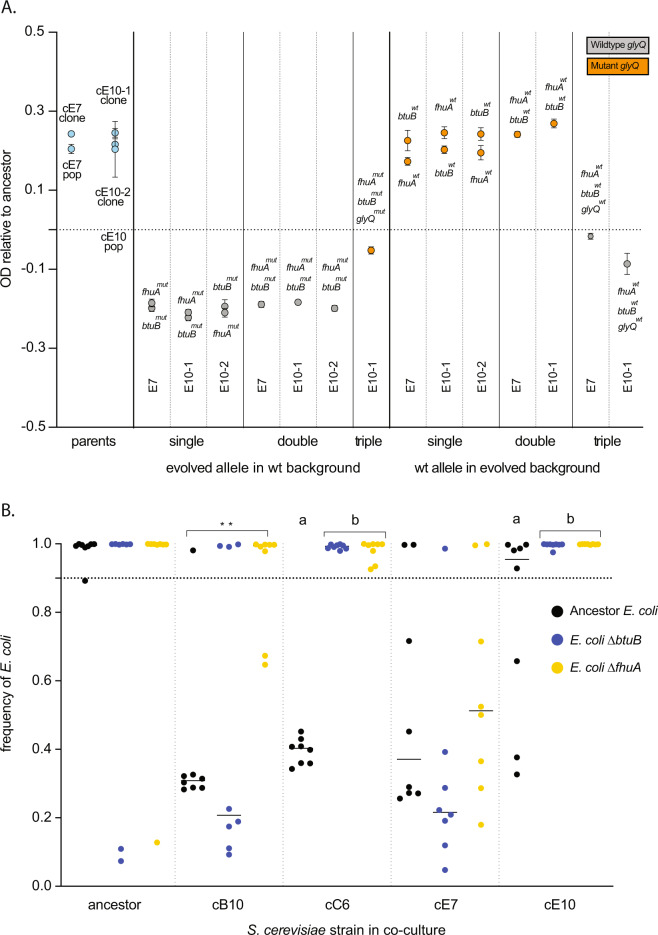
Fig. 5. The genetic causes of E. coli adaptation.
A Mutations in the essential gene glyQ cause the improved growth of evolved E. coli compared to ancestor E. coli. Growth was measured as OD600 attained after 24 h of incubation at experimental conditions. Each dot represents a distinct engineered clone, where either one, two, or three alleles were altered. In one example, the two grey dots in the column indicated “evolved allele in wt background, single, E7” denote two separate strains where the ancestor E. coli genotype was engineered to carry either the fhuA or btuB mutant alleles that evolved in the E7 co-culture E. coli. For a second example, the single grey dot in the right-most column indicated “wt allele in evolved background, triple, E10-1” denotes engineering of an E. coli clone from the E10 co-culture evolved population. Here three mutant alleles (fhuA, btuB, and glyQ) were replaced with the wild-type alleles. The growth of each measured strain is plotted relative to the ancestor, which is set at 0, (the dotted line), all measured strains were judged significantly different from the ancestor using bonferroni-corrected post-hoc t-tests, p < 0.001. Error bars represent standard error of the mean (SEM). B The final equilibrium frequency of ancestral and mutant E. coli co-cultured with ancestor and co-culture evolved S. cerevisiae populations after a reciprocal invasion assay (B). The equilibrium frequency of the ancestor E. coli when co-cultured with each of these S. cerevisiae populations is shown (black dots). Also shown are mutant E. coli engineered to contain either a btuB (blue dots) or fhuA mutation (yellow dots). Each dot represents a single replicate co-culture experiment. Stars show significant differences between individual comparisons; lower case letters show significantly different groups as designated by the Tukey’s post-hoc test.

