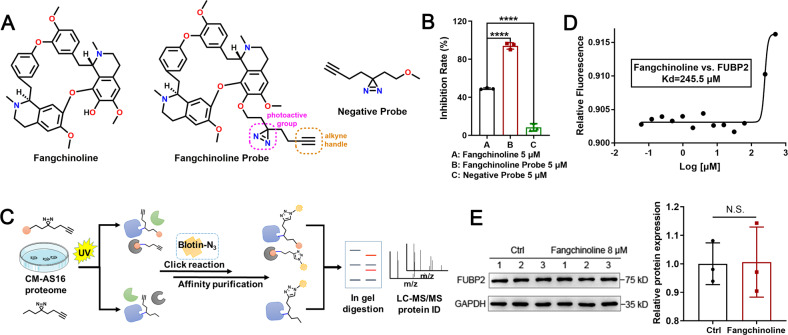
Fig. 3. Target search and verification of fangchinoline.
A Chemical structures of fangchinoline, the fangchinoline probe and the negative probe. The diazirine photo-cross-linking group is circled in pink, and the alkyne reporter group is circled in orange. B The inhibition rates of fangchinoline, fangchinoline probe and negative probe at a concentration of 5 μM against CM-AS16 cells. n = 3. C Schematic representation of the ABPP assay used to identify targets of fangchinoline in CM-AS16 cells. The ‘orange ball’ represents fangchinoline. D MST analysis of the binding affinity between fangchinoline and FUBP2. The measured Kd value is shown. E Immunoblotting for FUBP2 (left) and quantification of its protein abundance (right) in CM-AS16 cells with or without 8 μM fangchinoline treatment. Data represent the mean ± SD of three independent experiments. *P < 0.05, ****P < 0.0001, by Student’s t-test.

