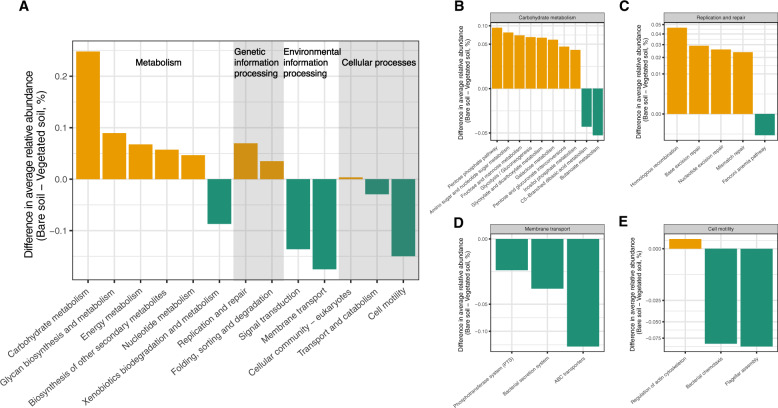
Fig. 2. Functional attributes of microbial communities.
Bar plots represent the differences in average relative abundances of KEGG pathways between bare and vegetated soils. Only those KEGG pathways that were significantly more abundant in bare soils (yellow) or vegetation soils (green) according to DESeq2 analysis (P < 0.05 after FDR correction) are shown.

