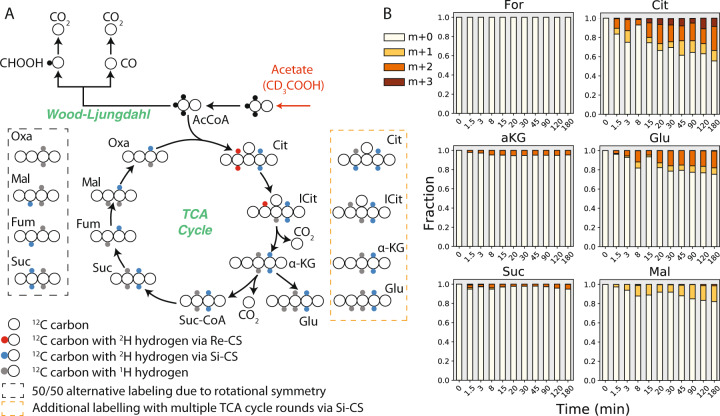
Fig. 6. 2H-acetate tracing suggests acetate oxidation by low abundance organism via Si-citrate synthase.
a Proposed pathways and deuterium labelling for acetate oxidation via the reverse Wood–Ljungdahl pathway and TCA cycle. Black circles indicate carbons with heavy (2H) hydrogen, red circles indicate carbons with 2H hydrogen produced via Re-citrate synthase, blue circles indicate carbons with 2H hydrogen produced via Si-citrate synthase, grey circles indicate carbons with 1H (unlabelled) hydrogen. b Time-series mass isotopomer distributions of selected TCA cycle metabolites during isotope tracer experiments with sodium acetate-d3 (CD3COOH). All measured metabolite MIDs represent the average of 2 independent biological replicate experiments. Metabolite MIDs and standard errors can be found in Supplementary Dataset 3. Reaction hydrogen atom transitions are provided in Supplementary Dataset 4.

