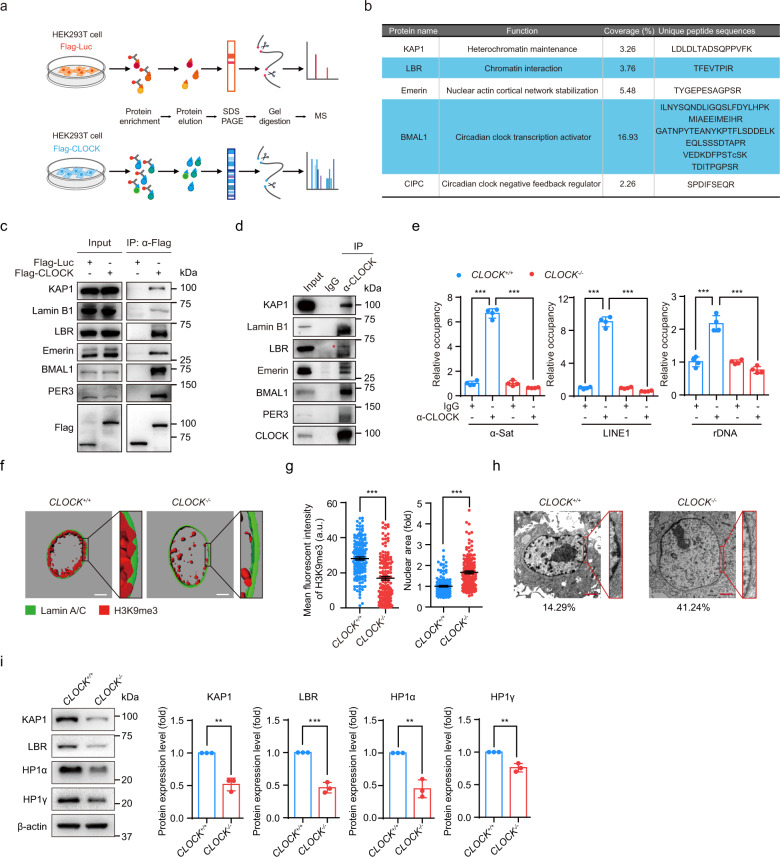
Fig. 2. CLOCK forms complexes with nuclear lamina proteins and the heterochromatin-associated protein KAP1.
a The flow chart of the mass spectrometry strategy for identifying interacting proteins of CLOCK. Luc was used as a control. b KAP1, LBR, Emerin, BMAL1 and CIPC were interacting proteins of CLOCK identified by mass spectrometry. Unique peptides of each interacting protein are listed in the table. c Co-IP analysis of KAP1, Lamin B1, LBR, Emerin, BMAL1 and PER3 with exogenous Flag-tagged CLOCK protein in HEK293T cells. Data are representative of three independent experiments. d Co-IP analysis of KAP1, Lamin B1, LBR, Emerin, BMAL1 and PER3 with endogenous CLOCK protein in CLOCK+/+ hMSCs. The red asterisk indicates the LBR band pulled down by IP with CLOCK antibody. Data are representative of two independent experiments. e Enrichment of CLOCK within α-Sat, LINE1, and rDNA regions, as measured by ChIP-qPCR. Data are presented as means ± SD. n = 4. ***P < 0.001 (two-tailed unpaired Student’s t-test). Data are representative of two independent experiments. f 3D construction of a z-stack of H3K9me3 (red) and Lamin A/C (green) immunofluorescence images of late-passage CLOCK+/+ and CLOCK−/− hMSCs (P9). Scale bars, 5 μm. g Left, mean fluorescence intensity of H3K9me3 in late-passage CLOCK+/+ and CLOCK−/− hMSCs (P9). Data are presented as means ± SEM. n = 150 cells from three biological replicates. ***P < 0.001 (two-tailed unpaired Student’s t-test). Right, quantitative nuclear area of late-passage CLOCK+/+ and CLOCK−/− hMSCs (P9). Data are presented as means ± SEM. n = 150 cells from three biological replicates. ***P < 0.001 (two-tailed unpaired Student’s t-test). h Electron microscopy analysis of the heterochromatin architecture at the nuclear periphery in late-passage CLOCK+/+ and CLOCK−/− hMSCs (P9). The percentages of cells with heterochromatin loss at the nuclear periphery are presented below the images. Scale bars, 2 μm. i Representative western blots of nuclear lamina and heterochromatin components in early-passage CLOCK+/+ and CLOCK−/− hMSCs (P4). β-actin was used as the loading control. Quantitative data to the right are presented as means ± SEM. n = 3 independent experiments. **P < 0.01; ***P < 0.001 (two-tailed unpaired Student’s t-test).

