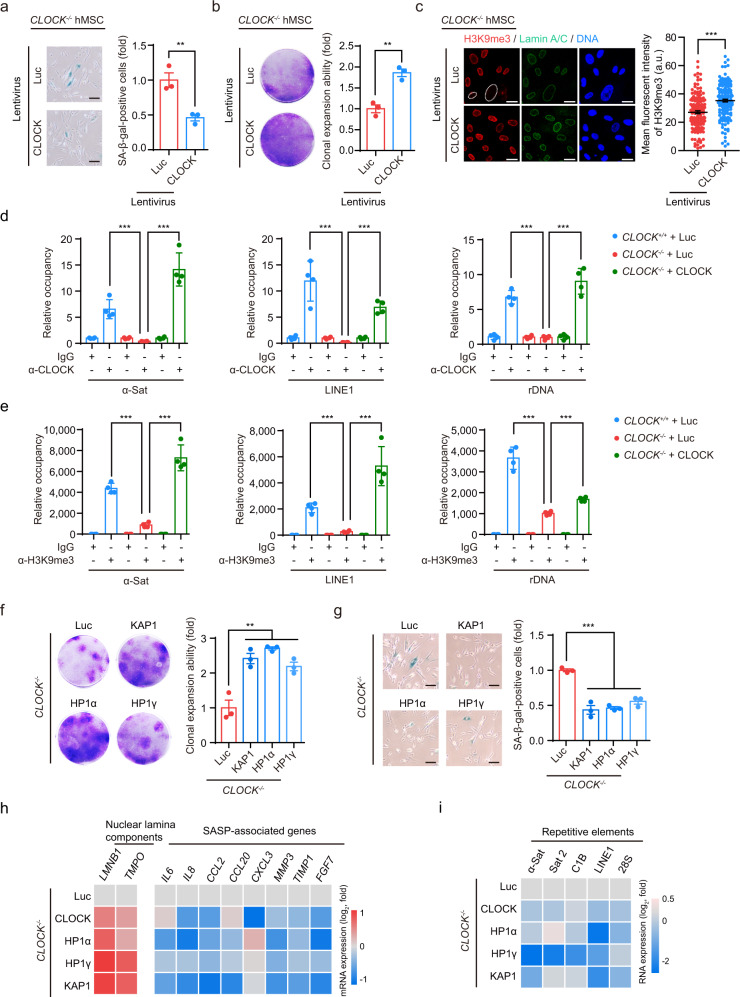
Fig. 4. CLOCK–heterochromatin axis protects hMSC against senescence.
a SA-β-gal staining of CLOCK−/− hMSCs transduced with lentiviruses expressing Luc or CLOCK. Data are presented as means ± SEM. n = 3 biological replicates. **P < 0.01 (two-tailed unpaired Student’s t-test). Scale bars, 100 μm. b Clonal expansion assay of CLOCK−/− hMSCs transduced with lentiviruses expressing Luc or CLOCK. Data are presented as means ± SEM. n = 3 biological replicates. **P < 0.01 (two-tailed unpaired Student’s t-test). c Immunofluorescence analysis of the H3K9me3 intensity in CLOCK–/– hMSCs transduced with Luc or CLOCK. Dashed lines indicate the nuclear boundaries of the cells with decreased H3K9me3 signals. Data are presented as means ± SEM. n = 150 cells from three biological replicates. ***P < 0.001 (two-tailed unpaired Student’s t-test). Scale bars, 25 μm. d Enrichment of CLOCK within α-Sat, LINE1, and rDNA regions, as measured by ChIP-qPCR, in CLOCK+/+ hMSCs transduced with Luc and CLOCK−/− hMSCs transduced with Luc or CLOCK. Data are presented as means ± SD. n = 4. ***P < 0.001 (two-tailed unpaired Student’s t-test). Data are representative of two independent experiments. e Enrichment of H3K9me3 within α-Sat, LINE1, and rDNA regions, as measured by ChIP-qPCR, in CLOCK+/+ hMSCs transduced with Luc and CLOCK−/− hMSCs transduced with Luc or CLOCK. Data are presented as means ± SD. n = 4. ***P < 0.001 (two-tailed unpaired Student’s t-test). Data are representative of two independent experiments. f Clonal expansion assay of CLOCK−/− hMSCs transduced with lentiviruses expressing Luc, KAP1, HP1α, or HP1γ. Data are presented as means ± SEM. n = 3 biological replicates. **P < 0.01 (two-tailed unpaired Student’s t-test). g SA-β-gal staining of CLOCK−/− hMSCs transduced with lentiviruses expressing Luc, KAP1, HP1α, or HP1γ. Data are presented as means ± SEM. n = 3 biological replicates. ***P < 0.001 (two-tailed unpaired Student’s t-test). Scale bars, 100 μm. h Heatmaps showing the relative mRNA levels of nuclear lamina components and SASP-associated genes in CLOCK−/− hMSCs transduced with lentiviruses expressing Luc, KAP1, HP1α, or HP1γ. The average expression levels of the indicated genes in each cell type were normalized to those in CLOCK−/− hMSCs transduced with Luc. Data are representative of two independent experiments. i Heatmap showing the relative transcript levels of repetitive elements in CLOCK−/− hMSCs transduced with Luc, KAP1, HP1α, or HP1γ. The average expression levels of the indicated repetitive elements in each cell type were normalized to those in CLOCK−/− hMSCs transduced with Luc. Data are representative of two independent experiments.

