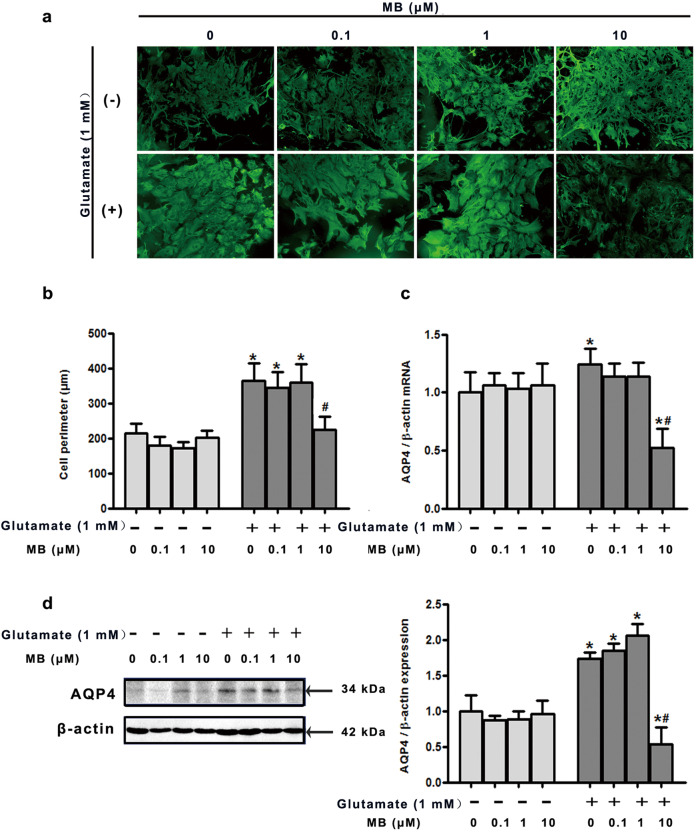
Fig. 3. Methylene blue (MB) attenuated cell swelling and elevated AQP4 expression in cultured astrocytes.
a Immunofluorescence staining of GFAP (shown in green); scale bar shows 200 μm. b Quantitative analysis of the imaging data of GFAP immunofluorescence staining (b). c, d AQP4 mRNA and protein were detected by qRT-PCR and Western blot. The data are presented as the mean ± SD (n = 9 for each group), *P < 0.05 vs. the control group (without glutamate and MB), #P < 0.05 vs. the glutamate group (1 mM glutamate and 0 mM MB)

