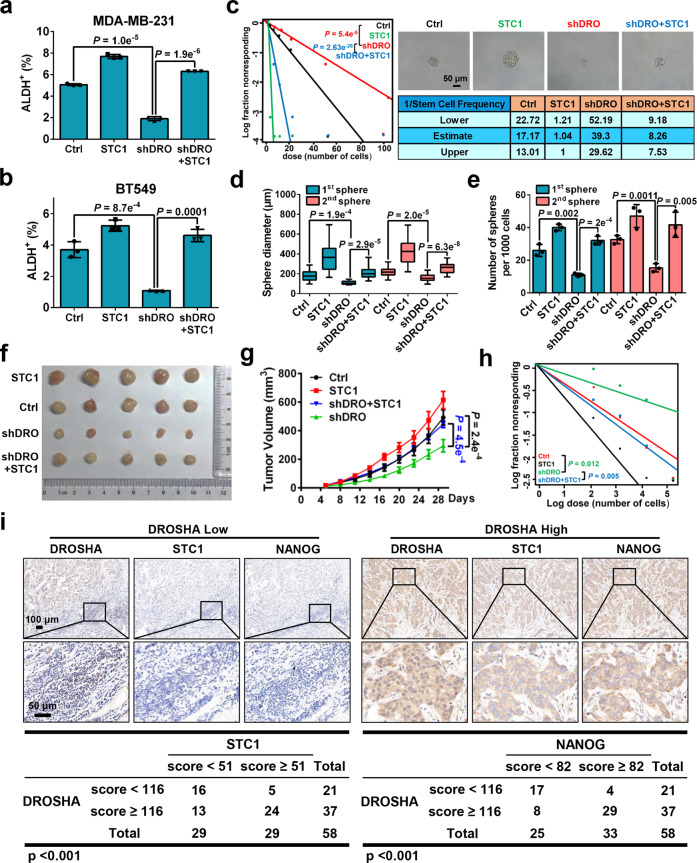
Fig. 2. DROSHA-STC1 axis promotes BCSC properties.
a, b ALDH+ populations were analyzed in MDA-MB-231 (a) and BT549 (b) cells with DROSHA knockdown and forced expression of STC1. shDRO, shRNA against DROSHA. STC1, overexpression of STC1. c Left: ELDA was performed in MDA-MB-231 cells with DROSHA knockdown and forced expression of STC1. Top right: The representative sphere images are shown. Scale bars, 50 μm. Bottom right: Stemness frequency illustration of the cells with the upper and lower 95% confidence intervals meaning that the frequency of one stem cell in cancer cells. Spheres were counted from 24 replicate wells. d, e Replating sphere formation was performed in MDA-MB-231 cells with DROSHA knockdown and forced expression of STC1. The diameter (d) and number (e) of spheres were quantified. Spheres were counted from three replicate wells. The diameter and number of each experiment represent the total count of three replicate wells. f, g Immunodeficient mice (n = 5, biological replicates) were subcutaneously inoculated with MDA-MB-231 cells with forced expression of STC1 and DROSHA silencing (f), and tumor volumes were monitored (g). Ctrl, control cells. h Secondary limited dilution xenograft was performed by plating gradually decreasing numbers of primary xenografted tumor cells into immunodeficient mice (n = 5, biological replicates) and calculated with ELDA analysis. i Representative images of DROSHA, STC1 and NANOG IHC staining in breast tumor specimens (n = 58, biological replicates). Scale bars, 100 μm or 50 μm. Data are shown as means ± SD. P values were calculated with two-tailed unpaired Student’s t-test in a, b, e, g, ANOVA test in d, χ2 test in c, h, Pearson’s correlation test in i. P < 0.05 is considered statistically significant.

