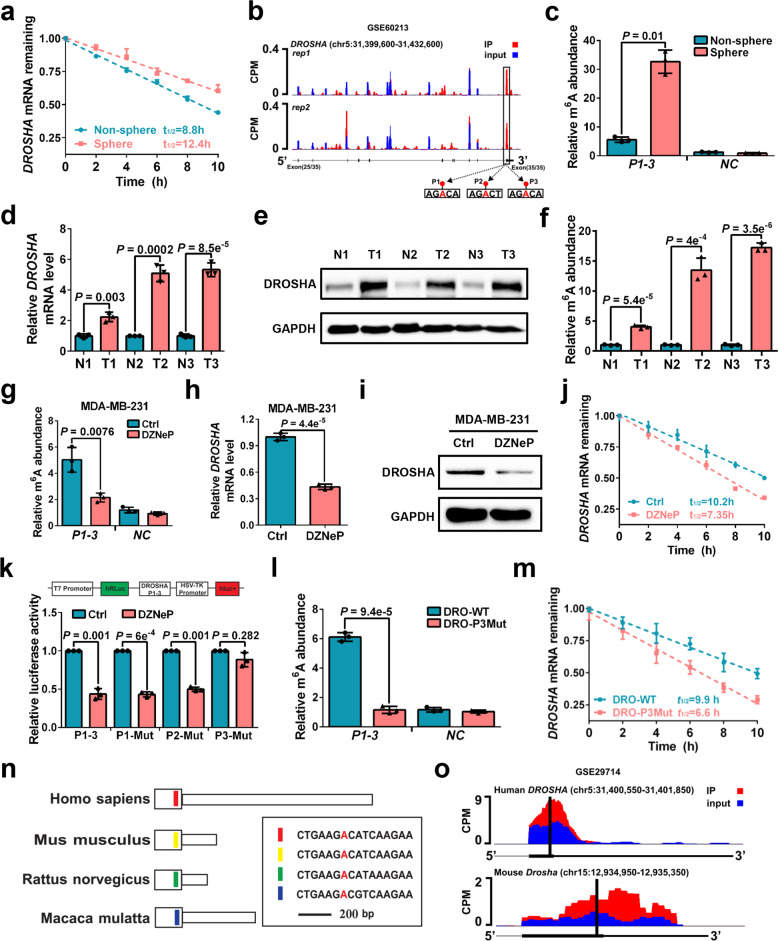
Fig. 3. DROSHA mRNA is stabilized by m6A deposition.
a Stability of DROSHA mRNA in non-sphere and sphere of MDA-MB-231 cells. mRNA levels were quantified by RT-qPCR. b UCSC Genome Browser plot containing tracks for m6A-seq IP reads (red) and input reads (blue) at the DROSHA locus by analyzing meRIP-seq data (GSE60213). The sequence of m6A motif near DROSHA stop codon is highlighted in three black boxes. c meRIP-qPCR was used to quantify relative DROSHA P1-3 m6A levels in non-sphere or sphere of MDA-MB-231 cells. NC, negative control, the primer of DROSHA non-m6A segment. d, e Relative mRNA (d) and protein (e) levels of DROSHA were determined between three breast tumor specimens and paired adjacent normal breast specimens. f meRIP-qPCR was used to quantify relative DROSHA m6A levels in three breast tumor specimens and paired adjacent normal breast specimens. g meRIP-qPCR was used to quantify relative DROSHA P1-3 m6A levels in MDA-MB-231 cells treated with DZNeP. h, i Relative mRNA (h) and protein (i) levels of DROSHA were determined in MDA-MB-231 cells treated with DZNeP. j Stability of DROSHA mRNA in MDA-MB-231 cells treated with DZNeP. k Relative luciferase activity of the DROSHA P1-3, P1-Mut, P2-Mut or P3-Mut reporter in HEK293T cells treated with DZNeP (n = 3, biological replicates). l meRIP-qPCR was used to quantify relative DROSHA P1-3 m6A levels in MDA-MB-231 cells with forced expression of DRO-WT and DRO-P3Mut. m Stability of DROSHA mRNA in MDA-MB-231 cells by forced expression of DRO-WT and DRO-P3Mut. n Diagram of the last exon of DROSHA genes from various organisms including coding sequence (large box) and 3’UTR. The conserved sequences are indicated by colored boxes. o m6A-seq reads cluster at the same distinct regions of DROSHA in both human brain RNA (top) and mouse brain RNA (bottom) by analyzing meRIP-seq data (GSE29714). Data are shown as means ± SD. P values were calculated with two-tailed unpaired Student’s t-test and P < 0.05 is considered statistically significant.

