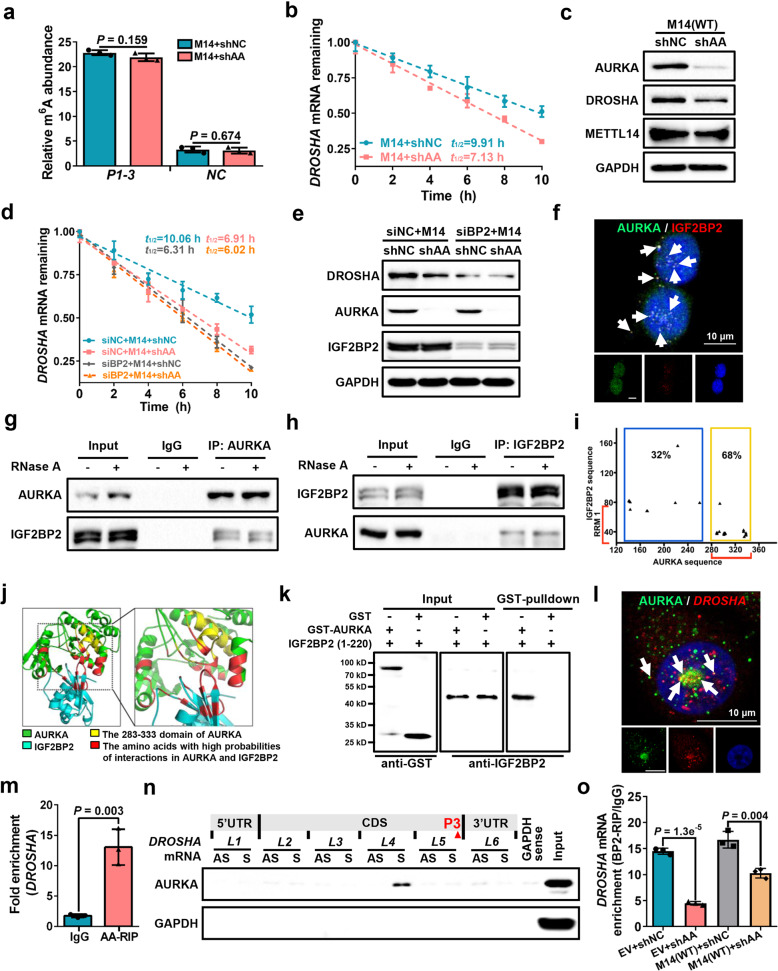
Fig. 5. AURKA strengthens IGF2BP2 binding to m6A for DROSHA transcript stabilization.
a meRIP-qPCR was performed to verify relative DROSHA P1-3 m6A levels in METTL14-overexpressing MDA-MB-231 cells with or without AURKA-deficiency. b Stability of DROSHA mRNAs were identified in METTL14-overexpressing MDA-MB-231 cells with or without AURKA-deficiency. c The protein expression of AURKA, DROSHA and METTL14 was identified in METTL14-overexpressing MDA-MB-231 cells with or without AURKA deficiency. d Stability of DROSHA mRNAs was evaluated in METTL14-overexpressing plus IGF2BP2-knockdown (siIGF2BP2) or siNC MDA-MB-231 cells with or without AURKA deficiency. e DROSHA, AURKA and IGF2BP2 proteins were detected by western blotting in METTL14-overexpression plus siIGF2BP2 or siNC MDA-MB-231 cells with or without AURKA deficiency. f The representative image of co-staining of AURKA protein (green) and IGF2BP2 protein (red) were observed in MDA-MB-231 cells. The nucleus was stained by DAPI (blue). Scale bars, 10 μm. g, h Co-IP assay to identify the endogenous interaction between AURKA and IGF2BP2 in MDA-MB-231 cells. Cell extracts were untreated (–) or treated (+) with RNase A (50 mg/mL). i The dot plot represents the amino acids in orange box located in the nucleotide 283–333 region of the AURKA sequence and the RRM region of the IGF2BP2 sequence. j The simulated interaction diagram of AURKA and IGF2BP2. k Direct interaction between GST-AURKA fusion protein and recombinant IGF2BP2 (1–220) protein was determined by in vitro interaction assay. l The representative image of co-staining (indicated by white arrows) of AURKA protein (green) and DROSHA mRNA (red) observed in the nucleus (blue). Scale bars, 10 μm. m Levels of AURKA-binding to DROSHA mRNA were determined by RIP assay in MDA-MB-231 cells. n Proteins in MDA-MB-231 cells pulled down by the indicated biotin-RNAs were analyzed with AURKA antibody. AS, antisense; S, sense. o Levels of IGF2BP2 binding to DROSHA mRNA were determined by RIP assay with or without AURKA-deficiency in control MDA-MB-231 cells or METTL14-overexpressing MDA-MB-231 cells. Data are shown as means ± SD. P values were calculated with two-tailed unpaired Student’s t-test and P < 0.05 is considered statistically significant.

