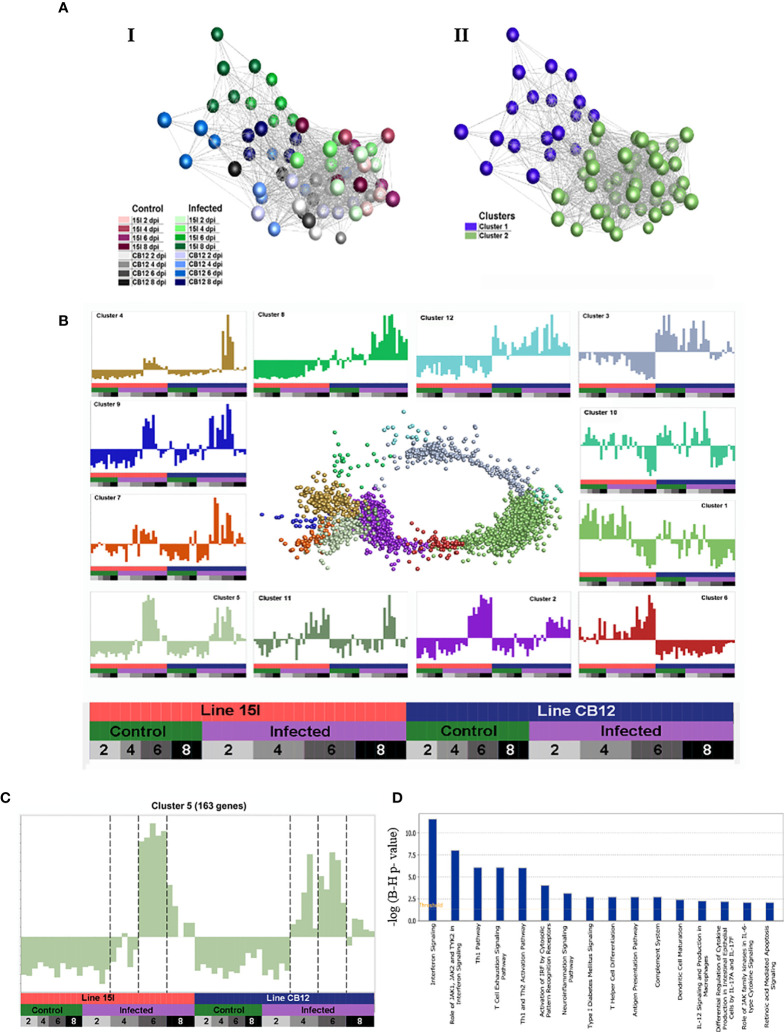
Figure 2.
A network graph of unbiased sample-to-sample and gene-to-gene clustering. Sample-sample networks colored by treatment group (A-I) and Markov clustering (A-II). Gene-gene network graph of Markov clustered genes (B), with normalized expression across samples (mean-centered scaling) of each cluster in the surrounding charts. Genes in cluster 5 (C) including IFN-γ and IL-10 have strongly elevated expression at 6 dpi in both lines of chickens, but also earlier at 4 dpi in line C.B12 chickens. Pathways enriched in cluster 5 are shown in (D).

