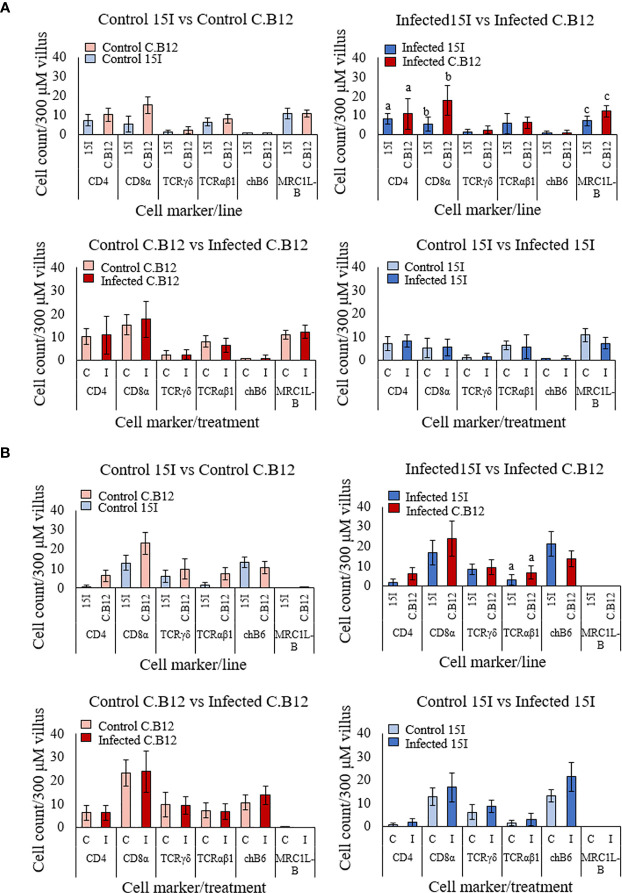
Figure 7.
Populations of CD4, CD8α, γδ T cells, αβ1 T cells, chB6 and MRC1L-B LPL (A) and IEL (B) in the jejunal villi of line C.B12 and line 15I chickens at 4 dpi with E. maxima. Shown are data comparing control birds of both lines, infected birds of both lines, control and infected line C.B12 birds and control and infected line 15I birds. LPL and IEL were counted from nine villi of one section per bird (n = 3 for uninfected and n ≥ 5 for infected groups). Each bar represents the mean number of cells per 300 μm of villus (± SD). Matching letters denote significant differences between groups (p < 0.05). C, Control; I, infected.

