Figure 1.
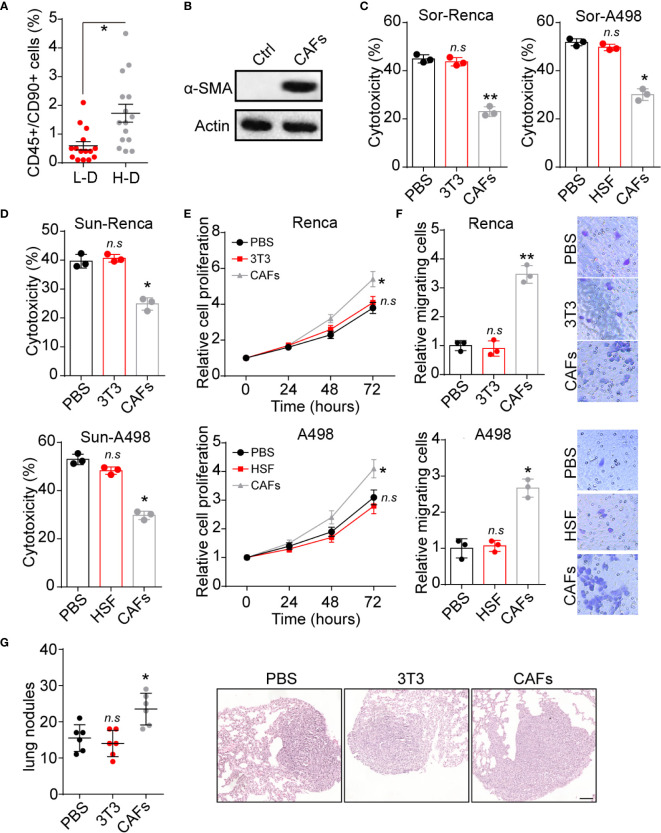
CAFs promoted renal cancer progression. (A) The percentage of CD45+/CD90+ cells subpopulation in tumor tissues from high degree (H-D) and low degree (L-D) malignant renal patients (n=15). (B) The western blotting of α-SMA in tumor tissues (ctrl) and CAFs isolated from tumor tissues of renal patients. (C) The cytotoxicity of Sor to Renca/A498 co-cultured with NIH-3T3, HSF or CAFs. (D) The cytotoxicity of Sun to Renca/A498 co-cultured with NIH-3T3, HSF or CAFs. (E) The relative cells proliferation of Renca/A498 co-cultured with NIH-3T3, HSF or CAFs. (F) The relative migrating cells numbers and representative images of Renca/A498 co-cultured with NIH-3T3, HSF or CAFs by transwell. (G) The lung nodules numbers and representative images of Renca lung metastasis mice models. Renca cells were co-cultured with NIH-3T3 or CAFs and 106 Renca were injected into BalB/C mice by tail vein, which were sacrificed on day 20. The scale bar is 200 μm. Mean ± SEM, n.s, no significant difference; *p < 0.05, **p < 0.01.

