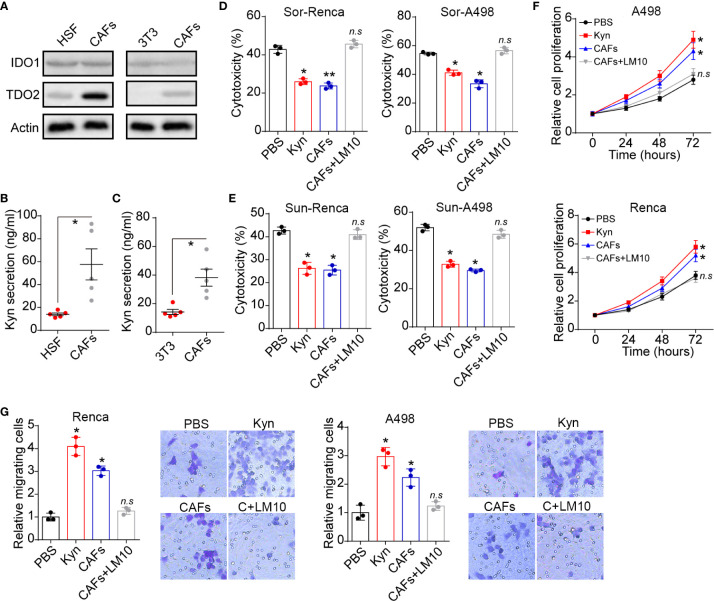
Figure 2.
CAFs secreted Kyn to regulate tumor progression. (A) The western blotting of IDO1, TDO2 and β-actin in HSF, NIH-3T3 and CAFs isolated from renal patients (compared to HSF) or Renca bearing mice (compared to Renca). (B) The Kyn concentration in culture medium of HSF or CAFs isolated from patients using Elisa analysis (105 cells in 2 ml culture medium, 48 hours). (C) The Kyn concentration in culture medium of NIH-3T3 or CAFs isolated from Renca bearing mice using Elisa analysis (105 cells in 2 ml culture medium, 48 hours). (D) The cytotoxicity of Sor to Renca/A498 treated with Kyn (0.5 μM), CAFs or CAFs combined with LM10 (2 μM). (E) The cytotoxicity of Sun to Renca/A498 treated with Kyn (0.5 μM), CAFs or CAFs combined with LM10 (2 μM). (F) The relative cell proliferation of Renca/A498 treated with Kyn (0.5 μM), CAFs or CAFs combined with LM10 (2 μM). (G) The relative migrating cells numbers and representative images of Renca/A498 treated with Kyn (0.5 μM), CAFs or CAFs combined with LM10 (2 μM). Mean ± SEM, n.s, no significant difference; *p < 0.05, **p < 0.01.

