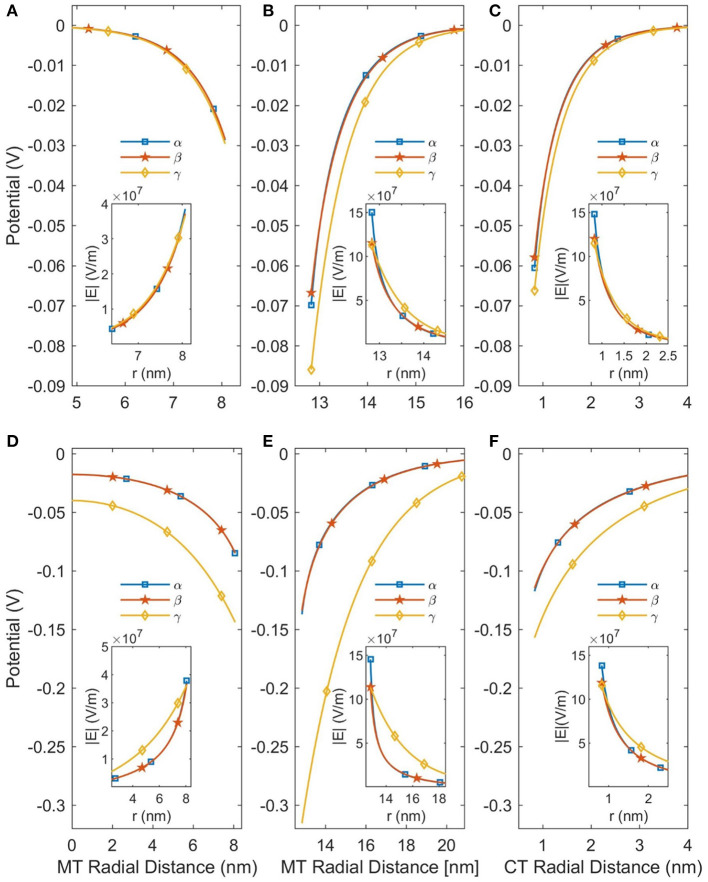
Figure 3.
This figure demonstrates the effects of linearizing the PB equation and accounting for a variable permittivity. The curves labeled α are the predictions of the NLPB equation with a variable relative permittivity; the β curves are the NLPB equation with a constant relative permittivity; and the γ curves are the LPB equation with a constant relative permittivity. (A–C) Are for SMTs in a background ionic concentration of 160 mM KCl, while (D–F) are for a background ionic concentration of 10 mM. The SMT radial distance is the distance from the center of an SMT and the CT radial distance is the distance from the center of a CT.

