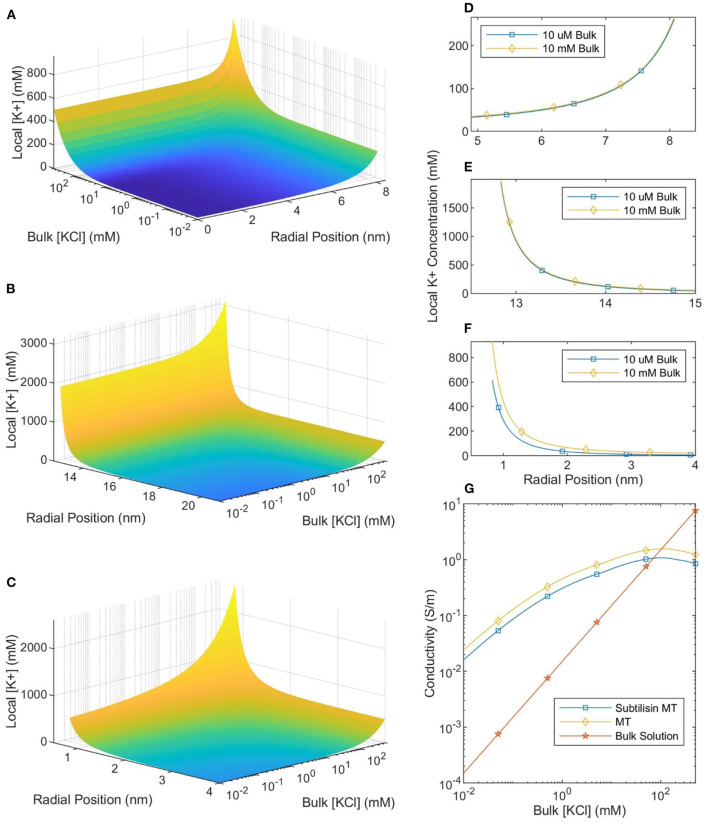
Figure 4.
The local counterionic concentration—as a function of buffer ionic concentration—in the lumen (A), around the outer SMT surface (B), and around a CT (C). The radial position in (A,B) is measured from the center of the SMT while the radial position in (C) is measured from the center of the CT. (D–F) Show the similarity of the counterionic concentration profiles—near the lumen, outer SMT surface, and CT surface, respectively—for MTs in 10 μM and 10 mM ionic buffer solutions. (G) Shows the conductivity of the bulk solution, an SMT-ion complex, and an MT-ion complex as a function of bulk solution ionic concentration.

