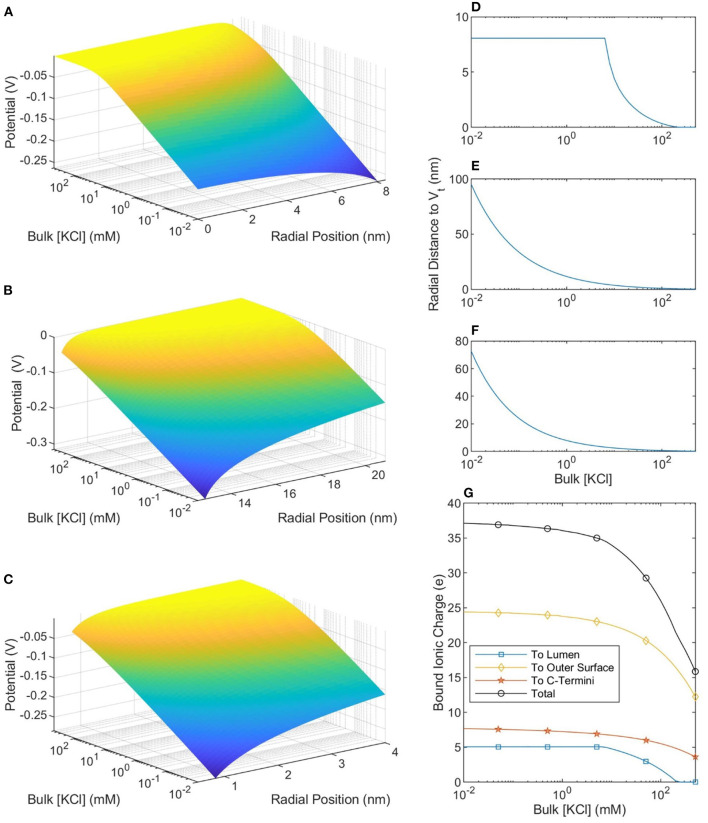
Figure 5.
The potential profiles—as a function of buffer ionic concentration—in the lumen (A), around the outer SMT surface (B), and around a CT (C). The radial position in (A,B) is measured from the center of the SMT while the radial position in (C) is measured from the center of the CT. (D–F) Show, respectively, the distance from the lumen, outer SMT surface, and CT surface to the thermal voltage. The maximum value in (D) is the radius of the lumen and at these points the entire lumen has a potential greater than the thermal potential. (G) Shows the total ionic charge within the thermal voltage potential, which can be considered the charge “bound” to the microtubule.

