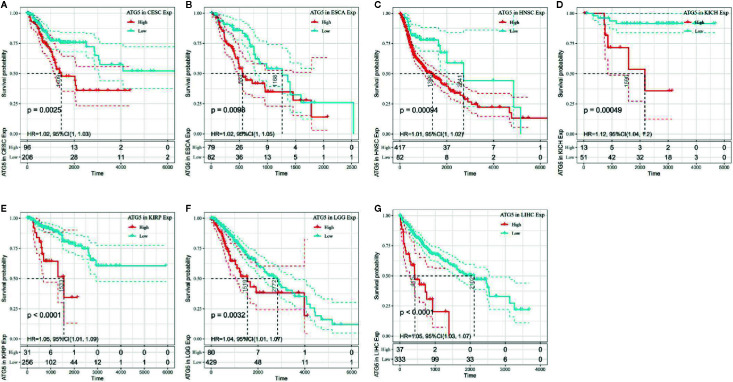
Figure 3.
Kaplan–Meier OS curves of ATG5 expression in the seven most significantly associated tumors. (A) KM plot of high and low ATG5 expression in CESC patients. (B) KM curves of high and low ATG5 expression in ESCA patients. (C) KM plot of high and low ATG5 expression in HNSC patients. (D) KM curves of high and low ATG5 expression in KICH patients. (E) KM curves of high and low ATG5 expression in KIRP patients. (F) KM curves of high and low ATG5 expression in LGG patients. (G) KM curves of high and low ATG5 expression in LIHC patients.

