

Abstract
Triple-negative breast cancer (TNBC) is a highly invasive subtype of breast cancer. This study investigated the molecular mechanism and influences of MIR503HG, miR-224-5p, and homeobox A9 (HOXA9) on TNBC cell growth and migration. Dual-luciferase reporter gene and RNA immunoprecipitation were performed to examine the regulation of MIR503HG, miR-224-5p, and HOXA9. Cell proliferation, apoptosis, migration, and invasion were evaluated by colony formation, flow cytometry, and Transwell assays. Finally, nude mice were employed to investigate the influence of MIR503HG on TNBC tumor growth. HOXA9 protein levels were detected by immunohistochemical staining. MIR503HG and HOXA9 expression were reduced in TNBC, while miR-224-5p was increased. Overexpression of MIR503HG or HOXA9 reduced the cell migration ability and proliferation and promoted apoptosis, and knockdown of MIR503HG or overexpression of miR-224-5p exhibited the opposite effects. Furthermore, MIR503HG promoted HOXA9 expression by inhibiting miR-224-5p. Overexpression of miR-224-5p reversed the effects of MIR503HG overexpression on TNBC cells, while overexpression of HOXA9 reversed the effect of MIR503HG knockdown. Additionally, an in vivo study proved that MIR503HG inhibited TNBC tumor growth via the miR-224-5p/HOXA9 axis. MIR503HG inhibited cell proliferation and promoted the apoptosis of TNBC cells via the miR-224-5p/HOXA9 axis, which may function as a novel target for the treatment of TNBC.
Keywords: MIR503HG, triple-negative breast cancer, TNBC, miR-224-5p, HOXA9, lncRNA
Graphical abstract
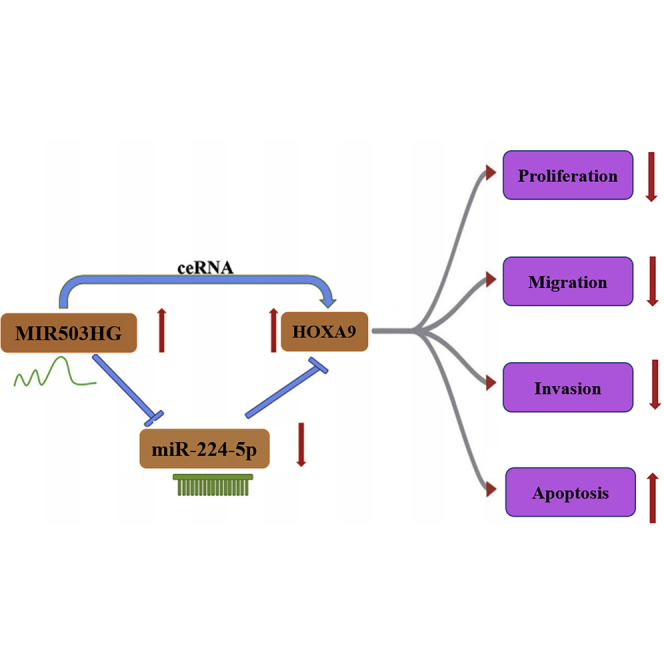
Overexpression of MIR503HG or HOXA9 reduced the cell migration ability and proliferation and promoted the apoptosis in vitro, and in vivo study proved that MIR503HG inhibited TNBC tumor growth. MIR503HG exerted antitumor effects on TNBC cells via the miR-224-5p/HOXA9 axis, which may function as a novel target for the treatment of TNBC.
Introduction
Triple-negative breast cancer (TNBC) is a highly invasive subtype of breast cancer that accounts for nearly 20% of all breast cancer cases.1 Immunohistochemistry analyses show that the expression of progesterone receptor, estrogen receptor, and HER2 is lacking in TNBC.2,3 TNBC may exhibit high infiltration, distant metastasis, high recurrence risk, poor prognosis, and low survival. Despite great efforts in clinical treatment strategies, significant improvements in patient survival have not yet been achieved.1,3 Thus, it would be highly desirable to investigate the molecular mechanisms of TNBC and develop novel anticancer strategies.
Long noncoding RNAs (lncRNAs), which are noncoding RNAs consisting of more than 200 nucleotides, are involved in the regulation of the occurrence and development of tumors.4,5 In particular, lncRNA MIR503HG serves as an important tumor suppressor in various human cancers.6, 7, 8, 9 However, the influence of MIR503HG on the proliferation and migration of TNBC cells has rarely been investigated. Recently, Fu et al.10 found that the expression of MIR503HG was significantly reduced in TNBC cell lines and tissues, with MIR503HG inhibiting cell migration and invasion in TNBC through the miR-103/OLFM4 axis.
On the other hand, microRNAs (miRNAs), which are noncoding single-stranded RNA molecules consisting of approximately 22 nucleotides, such as miR-21, miR-10b, miR-221, and miR-210, have been discovered, and the expression levels of these miRNAs are markedly different between normal tissues and tumors.11, 12, 13, 14 A recent study showed that miR-224-5p was overexpressed in breast cancer, especially in TNBC tissues.15 Knocking down miR-224-5p could reduce cell invasion, migration, and proliferation of MDA-MB-231 cancer cells.15 However, the underlying mechanisms of MIR503HG and miR-224-5p on the invasion, proliferation, or migration of TNBC cells have not been identified.
Recently, homeobox A9 (HOXA9) was found to be an important gene in the regulation of cancer growth and metastasis. Gilbert et al.16 found that the HOXA9 gene was downregulated in a variety of cancer cells and that the decrease in HOXA9 transcript levels was positively correlated with tumor metastasis and aggression. Additionally, some cancer stem cell characteristics can be mediated by lncRNA HOTTIP by regulating HOXA9 in pancreatic cancer.17 A recent report indicated that the HMGA2/TET1/HOXA9 pathway can modulate cell growth and metastasis in breast cancer.18
Bioinformatics analysis revealed that miR-224-5p has binding sites with MIR503HG and HOXA9. In view of their carcinogenic or inhibitory effects in TNBC and their potential interactions, we proposed that the MIR503HG/miR-224-5p/HOXA9 axis plays a role in TNBC. Hence, this study intends to study the molecular interaction mechanism of MIR503HG, miR-224-5p, and HOXA9 in TNBC by using molecular technology to identify a new molecular target for the prediction and therapeutic treatment of TNBC.
Results
Differential expression of MIR503HG, miR-224-5p, and HOXA9 in TNBC cells and tissues
The relative expression of MIR503HG, miR-224-5p, and HOXA9 in primary TNBC tissue and corresponding adjacent normal tissue was first measured using quantitative real-time PCR. As shown in Figures 1A–1C, the expression of MIR503HG and HOXA9 in TNBC tissues was significantly lower than that in adjacent tissues. In comparison, the expression of miR-224-5p was markedly higher in TNBC tissues than in adjacent tissues. Additionally, we measured the relative expression of MIR503HG, miR-224-5p, and HOXA9 in TNBC cell lines (MDA-MB-231, MDA-MB-453, MDA-MB-415, and MDA-MB-468) and a normal breast epithelial cell line (MCF-10A). The same trend was found in TNBC cell lines and normal cells (Figures 1D–1F), in which these TNBC cell lines exhibited low levels of MIR503HG and HOXA9 and higher levels of miR-224-5p than the normal breast epithelial cell line. We also analyzed the correlation between the expression of MIR503HG, miR-224-5p, and HOXA9 in TNBC samples. The results showed that MIR503HG was negatively correlated with miR-224-5p, miR-224-5p, and HOXA9 (Figures 1G and 1H), and MIR503HG expression was positively correlated with HOXA9 expression (Figure 1I).
Figure 1.

Expression patterns of MIR503HG, miR-224-5p, and HOXA9 in TNBC cells and tissues
(A–F) Relative expression levels of (A) MIR503HG, (B) miR-224-5p, and (C) HOXA9 in TNBC tissues and adjacent tissues, and relative expression levels of (D) MIR503HG, (E) miR-224-5p, and (F) HOXA9 in TNBC cells and normal human breast cells. (G–I) Correlations between MIR503HG, miR-224-5p, and HOXA9 in TNBC tissues. Data represent the means ± SD. ∗p < 0.05, ∗∗p < 0.01, ∗∗∗p < 0.001.
MIR503HG upregulated the expression of HOXA9 by inhibiting miR-224-5p
Next, we investigated the effect of MIR503HG overexpression in TNBC cell lines in vitro. Due to the low expression levels of MIR503HG in MDA-MB-231 and MDA-MB-453 cell lines, we selected these two cell lines for the following experiments. As shown in Figure 2A, the expression of miR-224-5p was significantly increased after transfection of miR-224-5p mimics but decreased after transfection of miR-224-5p inhibitor. According to the bioinformatics analysis in Figure 2B, MIR50HG and miR-224-5p might have binding sites. Moreover, transfection of miR-224-5p mimics significantly reduced the luciferase activity of HEK293T cells, and the miR-224-5p inhibitor increased luciferase activity in the MIR503HG-wild-type (WT) group, while significant differences were not observed in the MIR503HG-mutant (MUT) group (Figure 2C). In addition, MIR503HG and miR-224-5p were specifically enriched in AgO2 precipitates compared with immunoglobulin G (IgG) in the control (Figure 2D). Furthermore, the bioinformatics analysis in Figure 2E shows that MIR50HG and miR-224-5p might have binding sites. As shown in Figure 2F, miR-224-5p mimics significantly reduced the luciferase activity of HEK293T cells in the HOXA9-WT group, miR-224-5p inhibitor increased luciferin activity in the HOXA9-WT group, and significant differences in activity were not observed in the HOXA9-MUT group. After overexpression of MIR503HG, the expression of MIR503HG and HOXA9 in TNBC cells was increased and the expression of miR-224-5p was reduced (Figure 2G). Moreover, as shown in Figure 2H, after transfection of miR-224-5p mimics and inhibitor, HOXA9 expression levels were significantly decreased and increased, respectively, which indicated that MIR503HG could regulate HOXA9 expression by targeting miR-224-5p.
Figure 2.

After overexpression of MIR503HG, the expression of HOXA9 was increased by reducing the expression of miR-224-5p
(A) Binding site of MIR503HG and miR-224-5p. (B) Detection of the expression levels of miR-224-5p in MDA-MB-231 and MDA-MB-453 cell lines after miR-224-5p mimics transfection by quantitative real-time PCR. (C) Dual-luciferase reporter for MIR503HG and miR-224-5p gene detection. (D) RIP measurement. (E) Binding site of miR-224-5p and HOXA9. (F) Dual-luciferase reporter for HOXA9 and miR-224-5p gene detection. (G) Detection of the expression levels of MIR503HG, miR-224-5p, and HOXA9 by quantitative real-time PCR after overexpression of MIR503HG in MDA-MB-231 and MDA-MB-453 cell lines. (H) detection of HOXA9 expression level in MDA-MB-231 and MDA-MB-453 cell lines via quantitative real-time PCR after miR-224-5p inhibitor transfection. Data represent the means ± SD. ∗p < 0.05, ∗∗p < 0.01, ∗∗∗p < 0.001.
Overexpression of MIR503HG inhibited the migration and invasion of TNBC cells by inhibiting miR-224-5p
To test the effects of MIR503HG and miR-224-5p on the migration and invasion of TNBC cell lines, we performed Transwell experiments. The expression of MIR503HG, miR-224-5p, and HOXA9 was determined in MDA-MB-231 and MDA-MB-468 cells overexpressing MIR503HG. The results indicated that MIR503HG suppressed the expression of miR-224-5p while increasing the expression of HOXA9 (Figures 3A–3C). As shown in Figures 3D and 3E, overexpression of MIR503HG reduced the cell migration ability of MDA-MB-231 and MDA-MB-453 cells, while miR-224-5p overexpression enhanced the cell migration ability. miR-224-5p mimics reversed the inhibitory effect of OE-MIR503HG on cell migration ability. Furthermore, overexpression of MIR503HG also reduced the invasion of MDA-MB-231 and MDA-MB-453 cells, while miR-224-5p mimics enhanced invasion rates (Figures 3F and 3G). In addition, miR-224-5p mimics attenuated the effect of OE-MIR503HG on invasion ability (Figures 3F and 3G). The above data showed that MIR503HG regulated the migration and invasion of TNBC cell lines through miR-224-5p.
Figure 3.

Overexpression of MIR503HG inhibited TNBC cell migration and invasion by inhibiting the expression of miR-224-5p
(A–C) Expression of MIR503HG, miR-224-5p, and HOXA9 was determined by quantitative real-time PCR. (D and E) Transwell assays were performed to detect cell migration. (F and G) Transwell assays were performed to detect cell invasion. Data represent the means ± SD. ∗p < 0.05, ∗∗p < 0.01, ∗∗∗p < 0.001.
Overexpression of MIR503HG inhibited the proliferation and promoted the apoptosis of TNBC cells by inhibiting the expression of miR-224-5p
After researching the influence of MIR503HG on the migration and invasion of TNBC cell lines, we then investigated its effect on proliferation and apoptosis through colony formation and cell apoptosis assays, respectively. The cell proliferation results in Figures 4A and 4B show that the proliferation ability of TNBC cells was weakened due to the overexpression of MIR503HG. In contrast, overexpression of miR-224-5p could promote cell proliferation, whereas miR-224-5p mimics could attenuate the inhibitory effect of OE-MIR503HG on cell proliferation. In addition, overexpression of MIR503HG could promote apoptosis, while overexpression of miR-224-5p had the opposite result and could also reverse the effect of MIR503HG overexpression (Figures 4C and 4D).
Figure 4.

Overexpression of MIR503HG inhibited TNBC cell proliferation and promoted apoptosis by inhibiting the expression of miR-224-5p
(A and B) Clonal formation was performed to detect proliferation. (C and D) Apoptosis was detected by flow cytometry. (E and F) Detection of the protein expression levels of HOXA9, Bcl-2, Bax, and cleaved caspase-3 by western blotting. Data represent the means ± SD. ∗p < 0.05, ∗∗p < 0.01, ∗∗∗p < 0.001.
Finally, western blotting detection was carried out to detect the expression levels of HOXA9 and apoptosis-related proteins (Bcl-2, Bax, and cleaved caspase-3). As shown in Figures 4E and 4F, the Bcl-2 protein levels decreased and the HOXA9, Bax, and cleaved caspase-3 protein levels increased after overexpression of MIR503HG. In contrast, the Bcl-2 protein level increased and the HOXA9, Bax, and cleaved caspase-3 protein levels decreased after transfection with miR-224-5p mimics. Notably, significant changes were not observed in the expression level of these proteins after transfection of OE-MIR503HG and miR-224-5p mimics. These results are consistent with the flow cytometer assay, which proved that overexpression of MIR503HG inhibited the proliferation and promoted the apoptosis of TNBC cells by inhibiting the expression of miR-224-5p.
Overexpression of HOXA9 reversed the effect of MIR503HG knockdown on cell migration and invasion
According to our above study, HOXA9 plays an important role in the MIR503HG-based regulation of TNBC cells. To further verify this effect, we assessed the influence of HOXA9 overexpression on the migration and invasion of TNBC cell lines. The expression of MIR503HG, miR-224-5p, and HOXA9 was determined in MDA-MB-231 and MDA-MB-468 cells via HOXA9 overexpression and MIR503HG knockdown. The results indicated that knockdown of MIR503HG increased the expression of miR-224-5p but decreased the expression of HOXA9 (Figures 5A–5C). Then, quantitative real-time PCR and western blotting were performed to detect the HOXA9 mRNA and protein levels in TNBC cells after overexpression of HOXA9. As expected, the mRNA and protein levels of HOXA9 in the cells were markedly increased (Figures 5D–5F). We chose OE-HOXA9-1 with high overexpression efficiency for subsequent migration and invasion experiments. As shown in Figures 5G and 5H, overexpressing HOXA9 decreased cell migration ability, knocking down MIR503HG increased cell migration ability, and expressing OE-HOXA9 reduced the effect of sh-MIR503HG on cell migration ability. The same trend can be found in the cell invasion study shown in Figures 5I and 5J. All these results proved that overexpression of HOXA9 could reverse the effect of MIR503HG knockdown on the migration and invasion of TNBC cell lines.
Figure 5.

Overexpression of HOXA9 reversed the effect of MIR503HG knockdown on cell migration and invasion
(A–C) Expression of MIR503HG, miR-224-5p, and HOXA9 was determined by quantitative real-time PCR. (D) Quantitative real-time PCR detection of HOXA9 levels in cells after overexpression of HOXA9. (E and F) HOXA9 protein levels detected by western blotting. (G and H) Transwell assays were performed to detect cell migration. (I–J) Transwell assays were performed to detect cell invasion. Data represent the means ± SD. ∗p < 0.05, ∗∗p < 0.01, ∗∗∗p < 0.001.
Overexpression of HOXA9 reversed the effect of MIR503HG knockdown on cell proliferation and apoptosis
Next, we assessed the influence of HOXA9 overexpression on the proliferation and apoptosis of TNBC cell lines. Figures 6A and 6B show that cell proliferation was decreased after overexpressing HOXA9, the opposite results were observed after knocking down MIR503HG, and OE-HOXA9 attenuated the effect of sh-MIR503HG on cell proliferation. Then, apoptosis experiments showed that knockdown of MIR503HG could inhibit the apoptosis of TNBC cell lines, and overexpression of HOXA9 promoted the apoptosis of TNBC cells and reversed the effect of knockdown of MIR503HG (Figures 6C and 6D). To confirm this finding, western blotting was performed to detect the levels of HOXA9 and the cell apoptosis-associated proteins Bcl-2, Bax, and cleaved caspase-3. Figures 6E and 6F show that after HOXA9 overexpression, Bcl-2 protein levels decreased while HOXA9, Bax, and cleaved caspase-3 protein levels increased; after MIR503HG knockdown, Bcl-2 protein levels increased, while HOXA9, Bax, and cleaved caspase-3 protein levels decreased; and after cotransfection of OE-HOXA9 with sh-MIR503HG, the expression levels of each group of proteins did not change significantly. In summary, overexpression of HOXA9 reversed the effects of MIR503HG knockdown on TNBC cell proliferation and apoptosis.
Figure 6.

Overexpression of HOXA9 reversed the effects of MIR503HG knockdown on cell proliferation and apoptosis
(A and B) Clonal formation was performed to detect proliferation. (C and D) Apoptosis was detected by flow cytometry. (E and F) Protein expression levels of HOXA9, Bcl-2, Bax, and cleaved caspase-3 were detected by western blotting. Data represent the means ± SD. ∗p < 0.05, ∗∗p < 0.01, ∗∗∗p < 0.001.
Overexpressing MIR503HG in mice inhibited tumor growth
Finally, the influence of MIR503HG overexpression on TNBC tumor growth was investigated in vivo. Interestingly, MIR503HG overexpression induced a decrease in tumor volume and weight in nude mice (Figures 7A–7C). Next, the MIR503HG, miR-224-5p, and HOXA9 expression levels in mouse tumors after overexpression of MIR503HG were detected by quantitative real-time PCR analysis. This result is consistent with the in vitro study. After overexpressing MIR503HG, the MIR503HG level in tumor tissue increased, which decreased the expression of miR-224-5p in tumors; thus, the expression levels of HOXA9 increased substantially (Figure 7D). To confirm this finding, we examined the expression of HOXA9 protein in mouse tumor tissue using immunohistochemical (IHC) staining. As expected, HOXA9 protein levels in mouse tumors after overexpression of MIR503HG significantly increased (Figure 7E). In addition, after MIR503HG overexpression, the protein levels of the apoptosis-related proteins Bax and cleaved caspase-3 increased significantly, while that of Bcl-2 decreased, which is consistent with the in vitro study (Figures 7F and 7G). These results indicated that overexpression of MIR503HG could inhibit the growth of mouse tumors by inhibiting miR-224-5p to promote HOXA9 expression.
Figure 7.

MIR503HG inhibited TNBC tumor growth by downregulating miR-224-5p expression to increase HOXA9 levels in the body
(A) Tumors collected from mice. (B) Effect of MIR503HG overexpression on tumor volume in mice. (C) Effect of MIR503HG overexpression on tumor weight in mice. (D) Quantitative real-time PCR detection of MIR503HG, miR-224-5p, and HOXA9 expression levels in mouse tumor tissues after overexpression of MIR503HG. (E) Immunohistochemical detection of HOXA9. (F–G) Western blotting detection apoptosis-related proteins. Data represent the means ± SD. ∗p < 0.05, ∗∗p < 0.01, ∗∗∗p < 0.001.
Discussion
TNBC is defined by a lack of estrogen, progesterone, and ERBB2 receptor expression and exhibits aggressive clinical behavior, high recurrence risk, poor prognosis, and low survival.19 Thus, there is an urgent need to identify prognostic biomarkers of TNBC for therapeutic opportunities. To provide a new molecular target for the prediction and treatment of TNBC, this study examined the molecular interaction mechanism of MIR503HG, miR-224-5p, and HOXA9 in TNBC and their influences on the cell migration, invasion, and proliferation of TNBC. Herein, we found that MIR503HG could inhibit tumor development in both TNBC cells and a tumor model via the miR-224-5p/HOXA9 axis, which may function as a novel target for treating TNBC.
lncRNAs are extensively distributed regulators in mammals that play an important role in the gene regulation of TNBC cell lines.20,21 lncRNA has been reported as a novel marker for differentiating TNBC from non-TNBC. Recently, Han et al.7 found that MIR503HG inhibited the proliferation, migration and invasion of colon cancer cells via miR-107/Par4 axis. Dao et al.22 reported that knockdown of MIR503HG suppressed proliferation and promoted apoptosis of non-small cell lung cancer cells by modulating miR-625-5p and miR-489-3p. A recent study showed that MIR503HG expression was significantly reduced in TNBC tissues and cell lines.9 MIR503HG inhibited cell migration and invasion in TNBC through the miR-103/OLFM4 axis.10 In our study, MIR503HG expression was elevated in TNBC tissues and cell lines. In addition, overexpression of MIR503HG inhibited the growth of TNBC cells and tumors, and knockdown of MIR503HG promoted the growth of TNBC cell lines. These results indicated that MIR503HG might be used as a molecular therapeutic target for TNBC.
As a family of small noncoding RNAs modulating gene expression, microRNAs (miRNAs) regulate various biological processes, including epithelial-mesenchymal transition, cell invasion, drug resistance, and proliferation in cancer cells.23 It was reported that miRNAs may also serve as therapeutic targets or potential prognostic biomarkers in TNBC.23,24 Ouyang et al.25 found that miR-451a and miR-130a-3p were downregulated in TNBC, and nine of the eleven deregulated miRNAs were related to the chemoresistance of TNBC. In addition, miR-224 was found to be deregulated in a variety of human malignancies. It is upregulated in non-small-cell lung cancer26 and glioma27 and downregulated in prostate cancer28 and plays a dual regulatory role as either a tumor suppressor or an oncogene. However, the function of miR-224 and MIR503HG in breast cancer remains controversial. In this study, we found that the expression of miR-224-5p was increased in TNBC tissues and cells. Overexpression of miR-224-5p not only promotes the migration, invasion, and proliferation of TNBC cells but also inhibits the apoptosis of cells. Moreover, miR-224-5p overexpression also reverses the effects of MIR503HG overexpression on TNBC cells. In addition, overexpression of MIR503HG could inhibit the expression of miR-224-5p both in vitro and in vivo, suggesting that MIR503HG could serve as a tumor suppressor gene in TNBC by inhibiting the expression of miR-224-5p.
HOXA9 was identified as an important gene in the regulation of cancer growth and metastasis.16 Wang et al.29 found that miR-133b inhibited the metastasis by targeting HOXA9 in human colorectal cancer. Recently, Malek et al.30 reported that TWIST1-WDR5-Hottip regulates Hoxa9 chromatin to facilitate prostate cancer metastasis. In our study, we found that the expression levels of HOXA9 were decreased in TNBC tissues and cells. Overexpression of HOXA9 inhibited the migration, invasion, and proliferation ability of TNBC cells; resulted in the apoptosis of TNBC cells; and attenuated the effects of MIR503HG knockdown. In addition, MIR503HG could promote the expression of HOXA9 by inhibiting miR-224-5p in vivo and in vitro but was negatively correlated with miR-224-5p. These results indicated that MIR503HG could promote the expression of HOXA9 through microRNA sponge action and thus inhibit the development of TNBC.
In conclusion, MIR503HG could inhibit the growth and metastasis of TNBC through the miR-224-5p/HOXA9 axis, as demonstrated by in vitro and in vivo studies. These results provide insights on the apoptosis pathway of TNBC and a potential therapeutic target for TNBC patients.
Material and methods
Clinical samples
Twenty primary TNBC tissue samples and paired normal tissues were obtained and histologically identified by three clinical pathologists from Xiangya Hospital of Central South University. Before diagnosis, none of these patients were given anticancer treatments. These experiments were approved by Xiangya Hospital of Central South University and complied with the regulations of the Helsinki Declaration. All patients were informed of their diagnosis and signed forms attesting to their understanding of the purposes of this study.
Cell lines
Four human TNBC cell lines (MDA-MB-231, MDA-MB-468, MDA-MB-415, and MDA-MB-453), a human embryonic kidney cell line (HEK293T), and a human normal breast epithelial cell line (MCF-10A) originated from ATCC (American Type Culture Collection) and were cultivated in DMEM (Thermo Fisher Scientific, USA) supplemented with 10% fetal bovine serum (FBS) and 1% streptomycin-penicillin.
Cell transfection
The full-length sequences of MIR503HG and HOXA9 cDNA were amplified by using PCR and cloned into the pcDNA3.1 expression vector to obtain a MIR503HG overexpression vector (OE-MIR503HG) or HOXA9 overexpression vector (OE-HOXA9). The short hairpin RNA (shRNA) MIR503HG (sh-MIR503HG) and the negative control (sh-NC) were purchased from GenePharma. The miR-224-5p inhibitor, miR-224-5p mimic, inhibitor NC, and mimic NC were obtained from GenePharma. TNBC cells were transfected using Lipofectamine 2000 from Invitrogen.
Bioinformatics prediction of miRNA binding sites
The binding sites of miRNA/mRNA and miRNA/lncRNA were predicted on miRGate (http://mirgate.bioinfo.cnio.es/miRGate/) and starBase (http://starbase.sysu.edu.cn/), respectively.
Dual-luciferase reporter gene assay
We amplified 3′ UTR cDNA fragments of MIR503HG containing the putative WT or MUT miR-224-5p binding sites using the following primers: MIR503HG forward: 5′-CGC CCA ATC TGA GCC CGA G-3′ and reverse: 5′-AAA TAA TTA GCT CAA GAG ATT TGC AC-3′; HOXA9 forward: 5′-CAC AAA GCG GCT CTA AAC CTC A-3′ and reverse: 5′-GTG CAT CAC CCA GTA CAC AGA A-3′. The amplified cDNA fragments were cloned into the pmirGLO Dual-Luciferase vector (Promega, San Luis Obispo, CA, USA), and primers for pmirGLO Dual-Luciferase vector construction were as follows: MIR503HG forward: 5′-TGT AAT TCT AGT TGT TTA AAC GAG CTC GCT AGC CAC AAA GCG GCT CTA AAC CTC A-3′ and reverse: 5′-TGC CTG CAG GTC GAC TCT AGA GTG CAT CAC CCA GTA CAC AGA A-3′; HOXA9 forward: 5′-TGT AAT TCT AGT TGT TTA AAC GAG CTC GCT AGC CGC CCA ATC TGA GCC CGA G-3′ and reverse: 5′-CCT GCA GGT CGA CTC TAG AAA ATA ATT AGC TCA GAT AGAG CAC GCC CGA G-3′. Then, the WT or MUT vectors as well as miR-224-5p inhibitor or mimics were cotransfected into HEK293T cells with Lipofectamine 2000. After transfection for 48 h, a dual-luciferase reporter assay was carried out to measure the luciferase activity. The experiments were performed in triplicate.
RNA immunoprecipitation (RIP)
The RIP experiments were carried out by adopting an EZ-Magna RIP kit (Millipore, USA). First, lysis buffer was used to lyse the collected cells, and then magnetic beads with antibody targeting AgO2 or IgG as well as RIP buffer were added to the lysate. After this, proteinase K was employed for culture with these magnetic beads, and the precipitated RNA was subsequently eluted and purified by using PCR.
Western blotting
First, the proteins were extracted by using radioimmunoprecipitation assay buffer in the presence of protease inhibitor, and a BCA detection kit (Beyotime, China) was used to detect the protein concentrations. Subsequently, SDS-10% PAGE was added to detach the protein samples. Then, the treated proteins were transferred to polyvinylidene difluoride membranes (PVDF). After sealing with nonfat milk, the PVDF membrane was coincubated with primary antibodies overnight at 4°C, followed by probing with secondary antibodies for 2 h at room temperature, and then chemiluminescence was measured by using a detection kit. Primary antibodies against HOXA9 (1/1,000, ab191178), Bcl-2 (1/2,000, ab182858), Bax (1/1,000, ab32503), cleaved caspase-3 (1/1,000, ab49822), and β-actin (ab5694, 1/500) were procured from Abcam.
Quantitative real-time PCR analysis
The RNA of transfected cells and tissues was first collected with TRIzol reagent (Invitrogen, USA). After this, the reverse transcription of RNA into cDNA was carried out by using a reverse transcriptase kit from Invitrogen. PCR processes were conducted on an ABI 7500 Real-Time PCR System. The cycling parameters used were denaturation at 95°C for 10 min, 40 cycles of 15 s at 94°C, 30 s at 60°C, and 1 min at 72°C followed by a continuous melting curve. The 2−ΔΔCt method was adopted to calculate the relative expression levels. The primers used were as follows: MIR503HG forward: 5′-GCA TTG AAA ACC ACC CAA GT-3′ and reverse: 5′-CAT GCC AAT TGG AAC AAA GA-3′; miR-224-5p forward: 5′-CGG TCA AGT CAC TAG TGG TTC C-3′ and reverse: 5′-GTC GTA TCC AGT GCA GGG TCC GAG GTA TTC GCA CTG GAT ACG ACC TAA AC-3′; HOXA9 forward: 5′-CCA CGC TTG ACA CTC ACA CT-3′ and reverse: 5′-AGT TGG CTG CTG GGT TAT TG-3′; U6 forward: 5′-CTC GCT TCG GCA GCA CA-3′ and reverse: 5′-AAC GCT TCA CGA ATT TGC GT-3′; GAPDH forward: 5′-CCA GGT GGT CTC CTC TGA-3′ and reverse: 5′- GCT GTA GCC AAA TCG TTG T-3′.
Cell migration and invasion studies
For the cell migration studies, transfected cells were first collected, counted, and transferred into 8 μm pore size polycarbonate inserts in 200 μL of DMEM supplemented with 2% serum, and the assembly was placed into 24-well plates containing 800 μL complete medium. After 48 h of cultivation, nonmigrating and noninvasive cells were removed from the top of filters and methanol acetone was used to fix the migrating cells at the bottom of filters, which was followed by staining under 5% crystal violet and counting. The cell numbers were obtained by counting five random fields based on triplicate experiments.
For the cell invasion assay, transfected cells were collected, counted, and transferred to uncoated 8-μm Matrigel-coated pore size polycarbonate inserts in DMEM supplemented with 2% serum, and the assembly was placed into 24-well plates containing 800 μL complete medium. The following experimental steps were carried out for the cell migration assay.
Colony formation assay
A total of 500 cells were transferred to a plate, and fresh culture medium was added every 3 days to replace the old culture medium. After 2 weeks of cultivation, cells were fixed with methanol for 10 min, stained with methylene blue, and photographed.
Cell apoptosis assay
Transfected cells were cultured in a six-well plate for 24 h after reaching 80% confluency. The cells were then washed with fresh medium and incubated in the incubator for another 12 h. Subsequently, the cells were washed with PBS (pH 7.4) and digested by trypsin (without EDTA). Cells were collected and suspended in 0.4 mL of binding buffer. Then, the cells were treated with the probes annexin V-fluorescein isothiocyanate (FITC) and propidium iodide (PI) for 15 min and detected with flow cytometry (BD Biosciences, San Diego, CA, USA).
In vivo studies
All experiments conformed to the regulations of Xiangya Hospital of Central South University. Five-week-old BALB/c nude mice (Vital River, USA) were randomly divided into three groups (control, OE-MIR503HG, and vector groups), with 20 mice in each group. MDA-MB-231 cells (1 × 10⁷) containing vector or OE-MIR503HG were injected subcutaneously into nude mice. At a given time after injection (days 3, 7, 14, 21, and 28), three mice randomly selected from each group were sacrificed, and the tumor size and weight of mice were measured. During the experiment, the width (W) and length (L) of the tumors were determined. The volume (V) of the tumors was calculated as V = L × W2/2.
IHC staining
The mouse tumor was fixed and embedded in paraffin and then sliced into 5 μm sections. The sections were incubated with the primary antibody against HOXA9 (1:200) (Vector Laboratories) at 4°C overnight and probed with the secondary antibodies. IHC staining by diaminobenzidine was then carried out, and photos were taken by a fluorescence microscope for further analysis.
Statistical analysis
We used SPSS statistics 21.0 software to perform the statistical analysis. All experiments were repeated at least three times. Data were presented as the mean ± standard deviation (SD). One-way analysis of variance (ANOVA) was performed for comparisons between multiple groups, while Student’s t test (two-tailed) was performed for comparisons between two groups. p <0.05 was considered significant.
Acknowledgments
This work was supported by Natural Science Foundation of Hunan Province (no. 2019JJ40505).
Author contributions
Conceptualization, F.Y.C. and Z.Y.Z.; methodology, J.P., S.M.W., and K.J.Z.; investigation, J.P. and Z.Y.Z.; writing – original draft, S.C.P. and S.Y.W.; writing – review & editing, S.M.W. and F.Y.C.; funding acquisition, S.M.W.; resources, J.P.; supervision, F.Y.C.
Declaration of interests
The authors declare no competing interests.
References
- 1.Shilpi S., Shivvedi R., Khatri K. Triple Negative Breast Cancer (TNBC): A Challenge for Current Cancer Therapy. J. Hum. Virol. Retrovirol. 2018;6:00189. [Google Scholar]
- 2.da Silva J.L., Cardoso Nunes N.C., Izetti P., de Mesquita G.G., de Melo A.C. Triple negative breast cancer: A thorough review of biomarkers. Crit. Rev. Oncol. Hematol. 2020;145:102855. doi: 10.1016/j.critrevonc.2019.102855. [DOI] [PubMed] [Google Scholar]
- 3.De Laurentiis M., Cianniello D., Caputo R., Stanzione B., Arpino G., Cinieri S., Lorusso V., De Placido S. Treatment of triple negative breast cancer (TNBC): current options and future perspectives. Cancer Treat. Rev. 2010;36(Suppl 3):S80–S86. doi: 10.1016/S0305-7372(10)70025-6. [DOI] [PubMed] [Google Scholar]
- 4.Lv M., Xu P., Wu Y., Huang L., Li W., Lv S., Wu X., Zeng X., Shen R., Jia X. LncRNAs as new biomarkers to differentiate triple negative breast cancer from non-triple negative breast cancer. Oncotarget. 2016;7:13047–13059. doi: 10.18632/oncotarget.7509. [DOI] [PMC free article] [PubMed] [Google Scholar]
- 5.Wang Q., Gao S., Li H., Lv M., Lu C. Long noncoding RNAs (lncRNAs) in triple negative breast cancer. J. Cell. Physiol. 2017;232:3226–3233. doi: 10.1002/jcp.25830. [DOI] [PubMed] [Google Scholar]
- 6.Huang P.-S., Chung I.H., Lin Y.-H., Lin T.-K., Chen W.-J., Lin K.-H. The Long non-coding RNA MIR503HG enhances proliferation of human ALK-negative anaplastic large-cell lymphoma. Int. J. Mol. Sci. 2018;19:1463. doi: 10.3390/ijms19051463. [DOI] [PMC free article] [PubMed] [Google Scholar]
- 7.Han H., Li H., Zhou J. Long non-coding RNA MIR503HG inhibits the proliferation, migration and invasion of colon cancer cells via miR-107/Par4 axis. J. Exp. Cell Res. 2020;395:112205. doi: 10.1016/j.yexcr.2020.112205. [DOI] [PubMed] [Google Scholar]
- 8.Karner H.M., Sun S. LncRNA miR503HG is a new player in hepatocellular carcinoma metastasis. Noncoding RNA Investig. 2018;2:51. [Google Scholar]
- 9.Chuo D., Liu F., Chen Y., Yin M. LncRNA MIR503HG is downregulated in Han Chinese with colorectal cancer and inhibits cell migration and invasion mediated by TGF-β2. Gene. 2019;713:143960. doi: 10.1016/j.gene.2019.143960. [DOI] [PubMed] [Google Scholar]
- 10.Fu J., Dong G., Shi H., Zhang J., Ning Z., Bao X., Liu C., Hu J., Liu M., Xiong B. LncRNA MIR503HG inhibits cell migration and invasion via miR-103/OLFM4 axis in triple negative breast cancer. J. Cell. Mol. Med. 2019;23:4738–4745. doi: 10.1111/jcmm.14344. [DOI] [PMC free article] [PubMed] [Google Scholar]
- 11.Mulrane L., McGee S.F., Gallagher W.M., O’Connor D.P. miRNA dysregulation in breast cancer. Cancer Res. 2013;73:6554–6562. doi: 10.1158/0008-5472.CAN-13-1841. [DOI] [PubMed] [Google Scholar]
- 12.Dahiya N., Sherman-Baust C.A., Wang T.-L., Davidson B., Shih IeM., Zhang Y., Wood W., 3rd, Becker K.G., Morin P.J. MicroRNA expression and identification of putative miRNA targets in ovarian cancer. PLoS ONE. 2008;3:e2436. doi: 10.1371/journal.pone.0002436. [DOI] [PMC free article] [PubMed] [Google Scholar]
- 13.Reddy K.B. MicroRNA (miRNA) in cancer. Cancer Cell Int. 2015;15:38. doi: 10.1186/s12935-015-0185-1. [DOI] [PMC free article] [PubMed] [Google Scholar]
- 14.Turashvili G., Lightbody E.D., Tyryshkin K., SenGupta S.K., Elliott B.E., Madarnas Y., Ghaffari A., Day A., Nicol C.J.B. Novel prognostic and predictive microRNA targets for triple-negative breast cancer. FASEB J. 2018;32 doi: 10.1096/fj.201800120R. fj201800120R. [DOI] [PubMed] [Google Scholar]
- 15.Zhang L., Zhang X., Wang X., He M., Qiao S. MicroRNA-224 Promotes Tumorigenesis through Downregulation of Caspase-9 in Triple-Negative Breast Cancer. Dis. Markers. 2019;2019:7378967. doi: 10.1155/2019/7378967. [DOI] [PMC free article] [PubMed] [Google Scholar]
- 16.Gilbert P.M., Mouw J.K., Unger M.A., Lakins J.N., Gbegnon M.K., Clemmer V.B., Benezra M., Licht J.D., Boudreau N.J., Tsai K.K. HOXA9 regulates BRCA1 expression to modulate human breast tumor phenotype. J. Clin. Invest. 2010;120:1535–1550. doi: 10.1172/JCI39534. [DOI] [PMC free article] [PubMed] [Google Scholar]
- 17.Fu Z., Chen C., Zhou Q., Wang Y., Zhao Y., Zhao X., Li W., Zheng S., Ye H., Wang L. LncRNA HOTTIP modulates cancer stem cell properties in human pancreatic cancer by regulating HOXA9. Cancer Lett. 2017;410:68–81. doi: 10.1016/j.canlet.2017.09.019. [DOI] [PubMed] [Google Scholar]
- 18.Sun M., Song C.-X., Huang H., Frankenberger C.A., Sankarasharma D., Gomes S., Chen P., Chen J., Chada K.K., He C., Rosner M.R. HMGA2/TET1/HOXA9 signaling pathway regulates breast cancer growth and metastasis. Proc. Natl. Acad. Sci. USA. 2013;110:9920–9925. doi: 10.1073/pnas.1305172110. [DOI] [PMC free article] [PubMed] [Google Scholar]
- 19.Dent R., Trudeau M., Pritchard K.I., Hanna W.M., Kahn H.K., Sawka C.A., Lickley L.A., Rawlinson E., Sun P., Narod S.A. Triple-Negative Breast Cancer: Clinical Features and Patterns of Recurrence. Clin. Cancer Res. 2007;13:4429–4434. doi: 10.1158/1078-0432.CCR-06-3045. [DOI] [PubMed] [Google Scholar]
- 20.Tang J., Li Y., Sang Y., Yu B., Lv D., Zhang W., Feng H. LncRNA PVT1 regulates triple-negative breast cancer through KLF5/beta-catenin signaling. Oncogene. 2018;37:4723–4734. doi: 10.1038/s41388-018-0310-4. [DOI] [PubMed] [Google Scholar]
- 21.Lin A., Li C., Xing Z., Hu Q., Liang K., Han L., Wang C., Hawke D.H., Wang S., Zhang Y. The LINK-A lncRNA activates normoxic HIF1α signalling in triple-negative breast cancer. Nat. Cell Biol. 2016;18:213–224. doi: 10.1038/ncb3295. [DOI] [PMC free article] [PubMed] [Google Scholar]
- 22.Dao R., Wudu M., Hui L., Jiang J., Xu Y., Ren H., Qiu X. Knockdown of lncRNA MIR503HG suppresses proliferation and promotes apoptosis of non-small cell lung cancer cells by regulating miR-489-3p and miR-625-5p. Pathol. Res. Pract. 2020;216:152823. doi: 10.1016/j.prp.2020.152823. [DOI] [PubMed] [Google Scholar]
- 23.Yang F., Zhang W., Shen Y., Guan X. Identification of dysregulated microRNAs in triple-negative breast cancer (Review) Int. J. Oncol. 2015;46:927–932. doi: 10.3892/ijo.2015.2821. [DOI] [PubMed] [Google Scholar]
- 24.Lü L., Mao X., Shi P., He B., Xu K., Zhang S., Wang J. MicroRNAs in the prognosis of triple-negative breast cancer: A systematic review and meta-analysis. Medicine (Baltimore) 2017;96:e7085. doi: 10.1097/MD.0000000000007085. [DOI] [PMC free article] [PubMed] [Google Scholar]
- 25.Ouyang M., Li Y., Ye S., Ma J., Lu L., Lv W., Chang G., Li X., Li Q., Wang S., Wang W. MicroRNA profiling implies new markers of chemoresistance of triple-negative breast cancer. PLoS ONE. 2014;9:e96228. doi: 10.1371/journal.pone.0096228. [DOI] [PMC free article] [PubMed] [Google Scholar]
- 26.Cui R., Meng W., Sun H.-L., Kim T., Ye Z., Fassan M., Jeon Y.-J., Li B., Vicentini C., Peng Y. MicroRNA-224 promotes tumor progression in nonsmall cell lung cancer. Proc. Natl. Acad. Sci. USA. 2015;112:E4288–E4297. doi: 10.1073/pnas.1502068112. [DOI] [PMC free article] [PubMed] [Google Scholar]
- 27.Lu S., Wang S., Geng S., Ma S., Liang Z., Jiao B. Upregulation of microRNA-224 confers a poor prognosis in glioma patients. Clin. Transl. Oncol. 2013;15:569–574. doi: 10.1007/s12094-012-0972-2. [DOI] [PubMed] [Google Scholar]
- 28.Mavridis K., Stravodimos K., Scorilas A. Downregulation and prognostic performance of microRNA 224 expression in prostate cancer. Clin. Chem. 2013;59:261–269. doi: 10.1373/clinchem.2012.191502. [DOI] [PubMed] [Google Scholar]
- 29.Wang X., Bu J., Liu X., Wang W., Mai W., Lv B., Zou J., Mo X., Li X., Wang J. miR-133b suppresses metastasis by targeting HOXA9 in human colorectal cancer. Oncotarget. 2017;8:63935–63948. doi: 10.18632/oncotarget.19212. [DOI] [PMC free article] [PubMed] [Google Scholar]
- 30.Malek R., Gajula R.P., Williams R.D., Nghiem B., Simons B.W., Nugent K., Wang H., Taparra K., Lemtiri-Chlieh G., Yoon A.R. TWIST1-WDR5-Hottip regulates Hoxa9 chromatin to facilitate prostate cancer metastasis. Cancer Res. 2017;77:3181–3193. doi: 10.1158/0008-5472.CAN-16-2797. [DOI] [PMC free article] [PubMed] [Google Scholar]