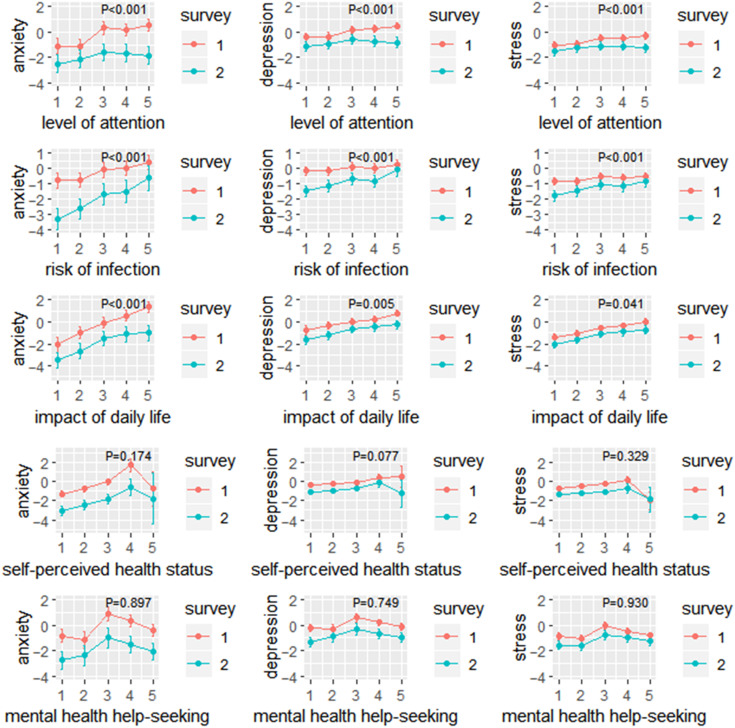
Figure 2.
The adjusted means of changes in anxiety, depression, and stress score according to 5 subjective indicators of changes of daily life in the 2 surveys. The P-value in the figure represents the result of the interaction between the according subjective indicator (including level of attention, risk of infection, impact of daily life, self-perceived health status, and mental health help-seeking) and surveys (survey 1 and 2) on the changes of 3 psychological scores (including anxiety, depression, and stress).

