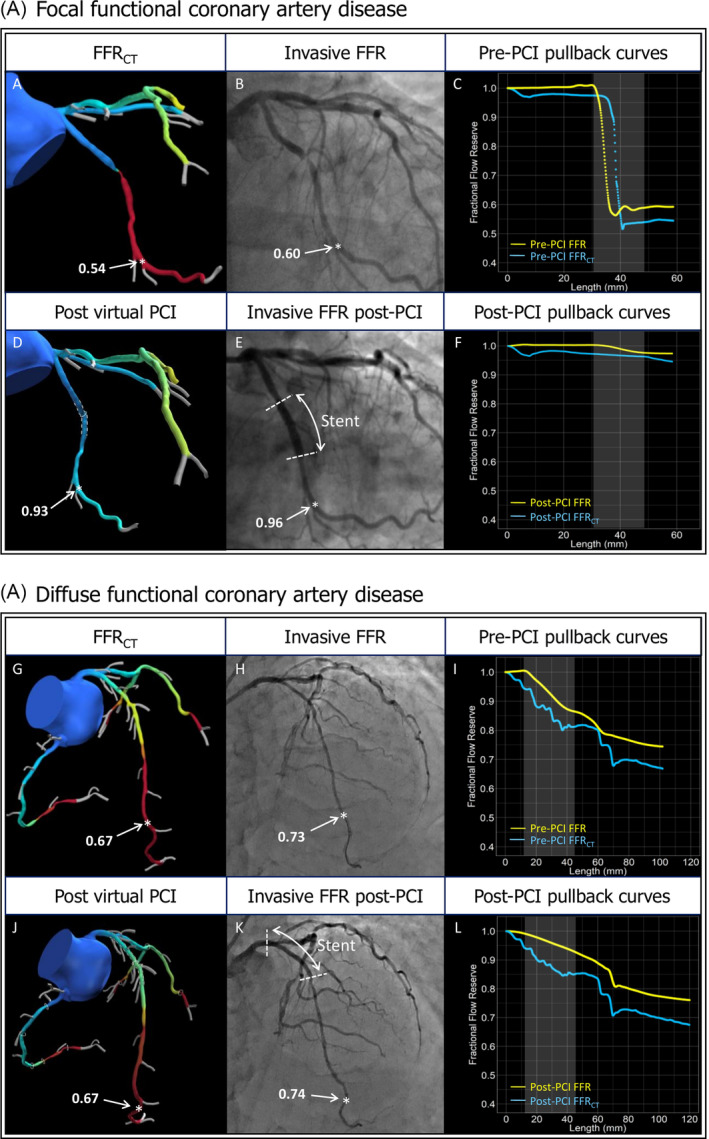
FIGURE 4.

Case example of the application of FFRCTPlanner incases with focal and diffuse functional coronary artery disease. (A) Focal functional coronary artery disease. Panel A shows the FFRCT model showing a focal, hemodynamic significant lesion in the Circumflex coronary artery. Panel B shows invasive angiography confirming an angiographic focal lesion. The position of the pressure wire sensor is denoted by a white star. Panel C shows the FFRCT and invasive FFR pullback curves. Panel D shows the remodeled geometry (white dashed lines) and presents the results of the blinded luminal remodeling using the FFRCT Planner. Panel E shows the location of distal invasive FFR assessment post‐PCI (white star) matched with the FFRCT model. The FFRCT Planner predicted a FFRCT value of 0.93 at the same position (white star) where the invasive FFR post‐PCI recorded 0.96. Panel F shows the corresponding post‐PCI pullback curves derived from FFRCT and invasive FFR (blue and yellow lines, respectively). (B) Diffuse functional coronary artery disease. Panel G shows a patient‐specific FFRCT model with diffuse pressure loss along the LAD and distal FFRCT value of 0.67. Panel H shows invasive coronary angiography with distal invasive FFR value of 0.73 (white stars). Panel I shows the FFRCT and FFR pullback curves pre‐PCI. Panel J shows the remodeled segment in the FFRCT model (white dashed lines) predicting a FFR of 0.67. Panel K shows the location of the invasive FFR measurement of 0.74 (white star). Panel L shows the post‐PCI pullback curves derived from FFRCT and invasive FFR (blue and yellow lines, respectively). FFRCT Fractional flow reserve derived from CT. FFR, fractional flow reserve; LAD, left anterior descending artery; PCI, percutaneous coronary intervention
