FIGURE 3.

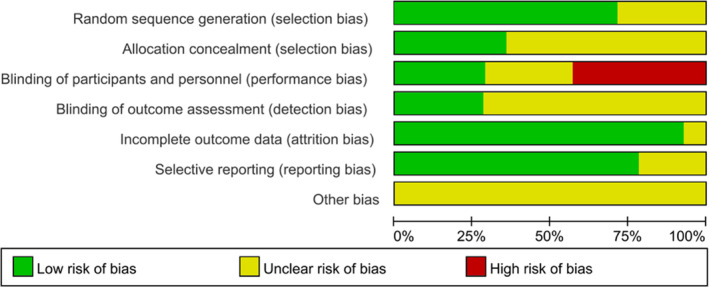
Risk of bias graph: an overall risk of bias of each domain. For example, the length of green rectangle means the number of studies being assessed as low risk of bias

Risk of bias graph: an overall risk of bias of each domain. For example, the length of green rectangle means the number of studies being assessed as low risk of bias