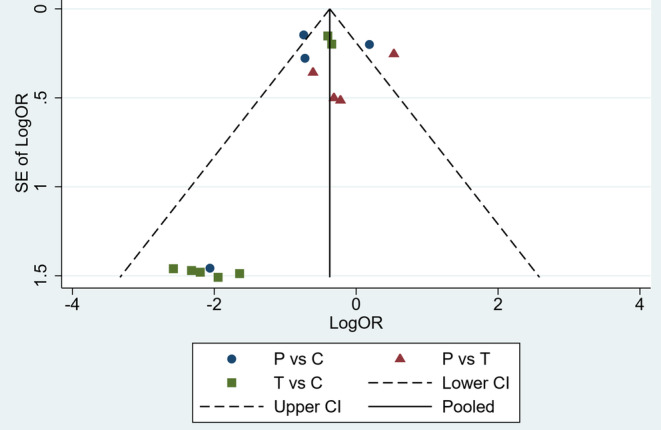
FIGURE 5.

Funnel plot analysis on publication bias. P, prasugrel; T, ticagrelor; C, clopidogrel; OR, odds ratio; S.E. standard error; 95% CI, 95% confidence interval

Funnel plot analysis on publication bias. P, prasugrel; T, ticagrelor; C, clopidogrel; OR, odds ratio; S.E. standard error; 95% CI, 95% confidence interval