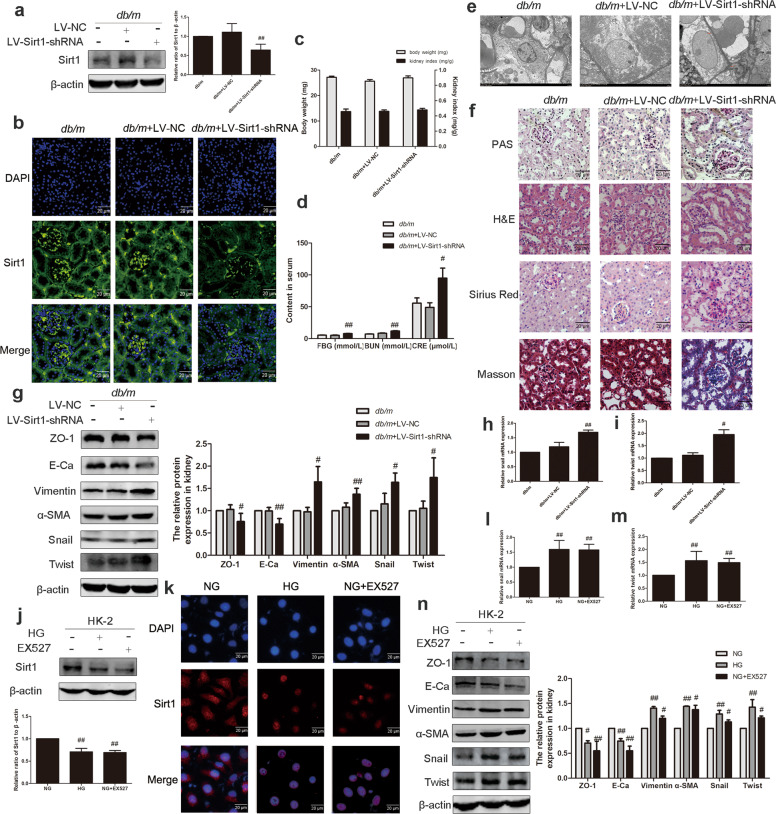
Fig. 2. Inhibition of Sirt1 promoted EMT in db/m mice and HK-2 cells.
a The relative protein levels of Sirt1 in db/m mice. Data are expressed as the mean ± SD, n = 6. ##P < 0.01 vs. db/m. b Distribution and expression of Sirt1 in db/m mice, as shown by immunofluorescence. Scale bar = 20 μm. c Effects of Sirt1 on the body weight and kidney index levels of db/m mice. d Effects of Sirt1 on the FBG, CRE, and BUN levels of db/m mice. Data are expressed as the mean ± SD, n = 6. #P < 0.05, ##P < 0.01 vs. db/m. e Transmission electron microscopy of renal tubular epithelial cells in db/m mice. f PAS, H&E, Sirius red, and Masson staining of renal cortex sections of mice. Scale bar = 20 μm. g The relative protein levels of EMT-associated proteins in mice. Data are expressed as the mean ± SD, n = 6. #P < 0.05, ##P < 0.01 vs. db/m. h, i Effects of Sirt1 on the mRNA levels of snail and twist in mice. Data are expressed as the mean ± SD, n = 6. #P < 0.05, ##P < 0.01 vs. db/m. j The relative protein levels of Sirt1 in HK-2 cells. Data are expressed as the mean ± SD, n = 3. ##P < 0.01 vs. NG. k Distribution and expression of Sirt1 in HK-2 cells, as shown by immunofluorescence. Scale bar = 20 μm. l, m Effects of Sirt1 on the mRNA levels of snail and twist in HK-2 cells. Data are expressed as the mean ± SD, n = 3. ##P < 0.01 vs. NG. n The relative protein levels of EMT-associated proteins in HK-2 cells. Data are expressed as the mean ± SD, n = 3. #P < 0.05, ##P < 0.01 vs. NG.

