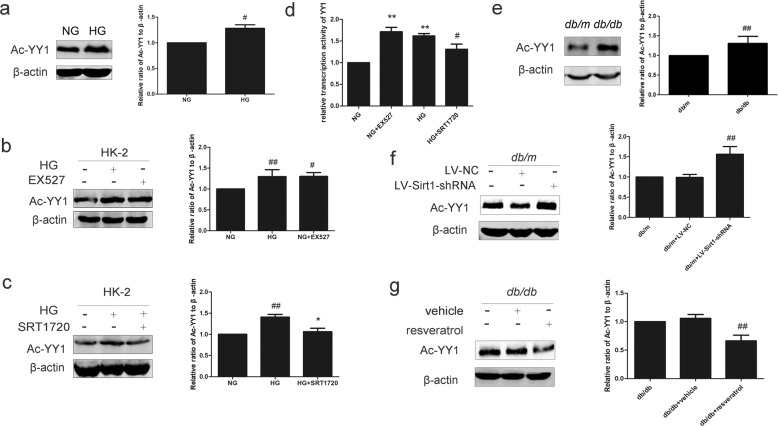
Fig. 4. Effect of Sirt1 on the acetylation of YY1 in HK-2 cells and mice.
a The relative protein levels of Ac-YY1 in HK-2 cells. Data are expressed as the mean ± SD, n = 3. #P < 0.05 vs. NG. b Effect of Sirt1 inhibition on the relative protein levels of Ac-YY1 in HK-2 cells. Data are expressed as the mean ± SD, n = 3. #P < 0.05, ##P < 0.01 vs. NG. c Effect of Sirt1 activation on the relative protein levels of Ac-YY1 in HK-2 cells. Data are expressed as the mean ± SD, n = 3. ##P < 0.01 vs. NG, and *P < 0.05 vs. HG. d The relative activity of YY1 in HK-2 cells by luciferase. Data are expressed as the mean ± SD, n = 3. **P < 0.01 vs. NG, and #P < 0.05 vs. HG. e The relative protein levels of Ac-YY1 in mice. Data are expressed as the mean ± SD, n = 6. ##P < 0.01 vs. db/m. f Effect of Sirt1 inhibition on the relative protein levels of Ac-YY1 in db/m mice. Data are expressed as the mean ± SD, n = 6. ##P < 0.01 vs. db/m. g Effect of Sirt1 activation on the relative protein levels of Ac-YY1 in db/db mice. Data are expressed as the mean ± SD, n = 6. ##P < 0.01 vs. db/db.

