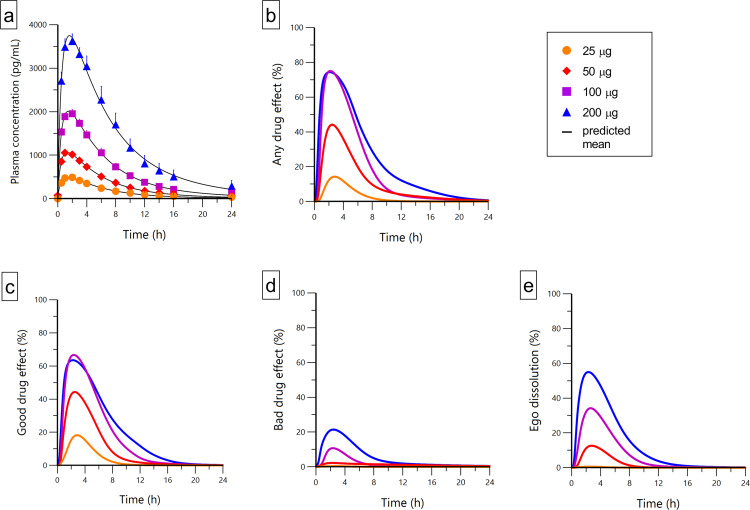
Fig. 4. Pharmacokinetics and subjective effects of lysergic acid diethylamide (LSD).
a Plasma LSD concentration-time curves for 25, 50, 100, and 200 µg doses of LSD. b–e LSD effect-time curves for Visual Analog Scale ratings (0–100%) of (b) “any drug effect,” (c) “good drug effect,” (d) “bad drug effect,” and (e) “ego dissolution.” LSD administration resulted in dose-proportional increases in plasma concentrations of LSD, but subjective good drug effects reached a ceiling at the 100 μg dose and did not further increase at the 200 µg dose. In contrast, bad drug effects and ego dissolution increased further at the 200 µg dose compared with 100 µg. Therefore, LSD doses higher than 100 µg produced no further increases in good drug effects but more ego dissolution and anxiety. The data are expressed as the mean ± SEM in 16 subjects. LSD was administered at t = 0 h. The lines represent the means of the individual pharmacokinetic–pharmacodynamic (subjective effect) model predictions.

