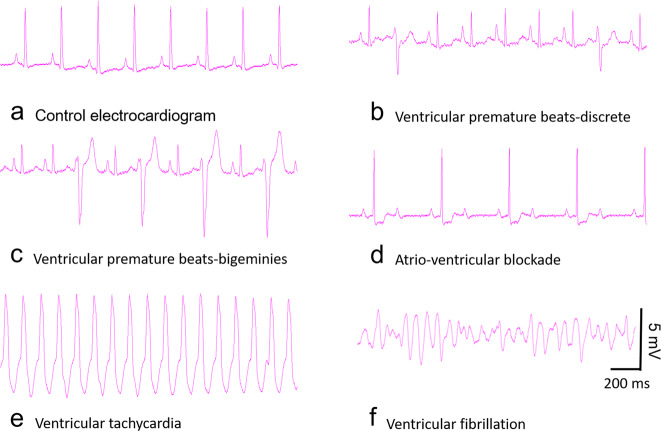
Fig. 1. Typical ECG traces showed various types of ventricular arrhythmias induced by ACO in guinea pigs.
The traces were recorded by an RM-6240 multiple-channel ECG recorder (lead II, 50 ms, 20 mV/division). a Control ECG tracing. ECG traces of VPBs (b, c), AVB (d), VT (e), and VF (f) induced by 25 μg/kg ACO. The ECG traces were chosen from 1 of the 10 independent experiments with ACO treatment. The vertical line indicates 5 mV, and the horizontal line indicates 200 ms. As very similar arrhythmic changes were noticed from MACO (25 μg/kg)-treated guinea pigs, ECG traces of MACO treatment were not shown. Quantitative analysis of the data is shown in Table 1.

