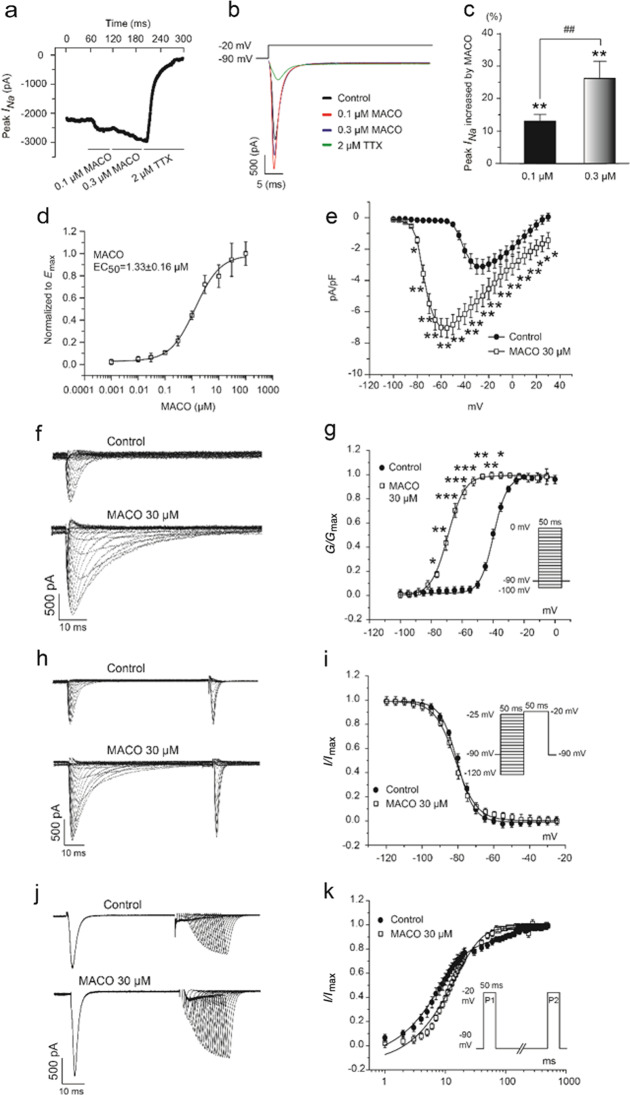
Fig. 5. Effects of MACO on the kinetics of peak INa in guinea pig ventricular myocytes.
a The time course of the peak INa in the presence of MACO or TTX. b Typical traces of peak INa recorded in the presence of MACO or TTX. The inset shows a schematic of the voltage-clamp protocol. c Summarized data of the effects of the percentage increase in MACO on the peak INa. d The concentration-response curves of the effects of MACO on peak INa, where the concentration-response relationships were fitted by the logistic function. e Summarized data of the I–V relationship of peak INa after 30 μM MACO treatment. f Representative peak INa traces of steady-state activation before and after MACO treatment. The inset shows the schematic of the voltage-clamp protocol. g Summarized data of steady-state activation of peak INa. h Representative peak INa traces of steady-state inactivation before and after MACO treatment. The inset shows a schematic of the voltage-clamp protocol. i Summarized data of steady-state inactivation curves of peak INa. j Representative peak INa recovery traces from inactivation in response to voltage commands consisting of two −20 mV depolarization pulses (P1 and P2) from a holding potential of −90 mV, separated by a 1–20-ms or a 20–500-ms variable interval (P1–P2) at −90 mV before and after MACO treatment. The inset shows the voltage-clamp protocol. k Normalized peak INa recovery (P2/P1) vs. interpulse interval at −90 mV. There were 5–7 cells from three guinea pig hearts in each group. *P < 0.05, **P < 0.01, ***P < 0.001 vs. control group; ##P < 0.01 vs. 0.1 μM MACO.

