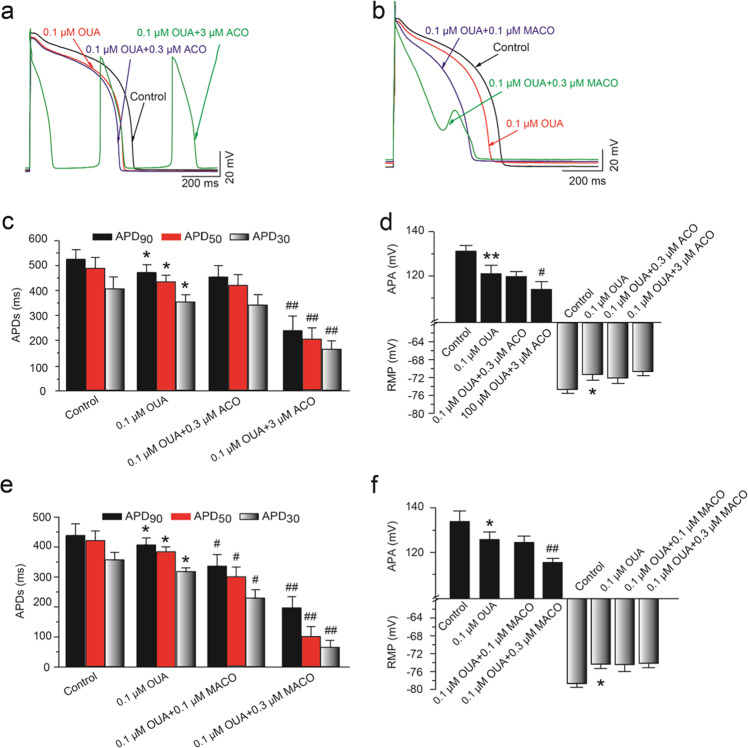
Fig. 6. Effects of ACO or MACO on AP configurations in the presence of OUA in guinea pig ventricular myocytes.
a, b Typical traces of superimposed APs recorded before and after exposure to OUA and ACO or MACO in the presence of OUA, respectively. Quantitative data for AP parameter measurements in the presence of OUA. c Effects of ACO on APD30, APD50, and APD90. d Effects of ACO on APA and RMP. e Effects of MACO on APD30, APD50, and APD90. f Effects of MACO on APA and RMP in the presence of OUA. There were seven cells from three guinea pig hearts in each group. *P < 0.05, **P < 0.01 vs. control group; #P < 0.05, ##P < 0.01 vs. OUA group.

