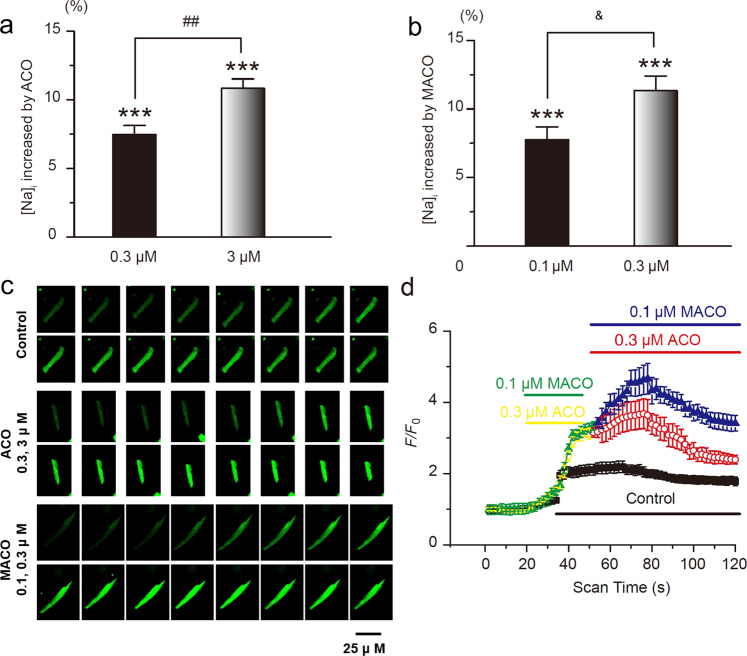
Fig. 8. Effects of ACO and MACO on [Na]i and [Ca2+]i in guinea pig ventricular myocytes.
a, b ACO and MACO increased [Na]i in a concentration-dependent manner in guinea pig ventricular myocytes. c Representative fluorescent images of ventricular myocytes loaded with Fluo-4/AM before (control) and after the addition of ACO (0.3 or 3 μM) or MACO (0.1 or 3 μM). In the control group, images 1–3 and 4–16 represent before and after the addition of high-K+ solution to the extracellular solution. In the ACO or MACO group, images 1–3 represent before the addition of high-K+ solution, and images 4–8 and 9–16 represent before and after the addition of high-K+ solution containing ACO (0.3, 3 μM) or MACO (0.1, 0.3 μM). The images were captured at 1 frame per 8 s, and then IF was analyzed. d Changes in [Ca2+]i by ACO and MACO are expressed as F/F0. There were seven cells from three guinea pig hearts in each group. ***P < 0.001, vs. control group; ##P < 0.01, vs. 0.3 μM ACO group; &P < 0.05, vs. 0.1 μM MACO group.

