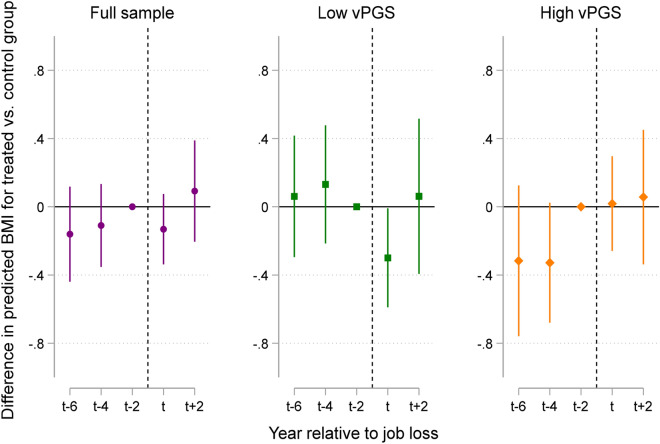
Figure 3.
Difference in predicted BMI for treatment and control groups by the year relative to job loss for the entire analytic sample and stratified at the vPGS median. The figure plots the coefficients from an event time study model for the full sample and by samples stratified at the vPGS median (see Methods). The reference category is BMI in t − 2, or BMI at baseline before the job loss occurred for treated individuals. The dotted line depicts the approximate time point that the job loss occurred—i.e., at some point between t − 2 and the wave a job loss was reported, or time t. Error bars represent 95% confidence intervals.

