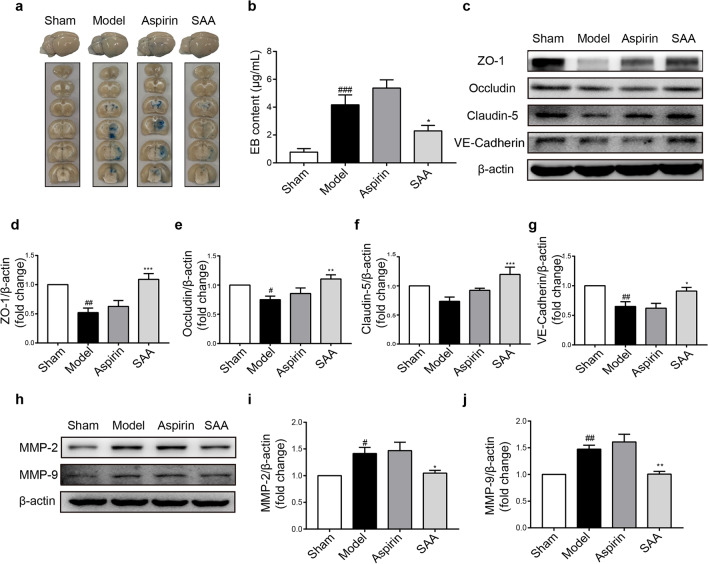
Fig. 4. SAA attenuated BBB injury and TJ degradation caused by ischemic stroke.
a Representative image of EB leakage. b Bar graph of EB content. EB content was measured 24 h after ischemic stroke. c–j Representative Western blot showing ZO-1, Occludin, Claudin-5, VE-cadherin, MMP-2, and MMP-9 expression. n = 6, mean ± SEM. #P < 0.05, ##P < 0.01 and ###P < 0.001 vs the sham group, *P < 0.05, **P < 0.01 and ***P < 0.001 vs the model group.

