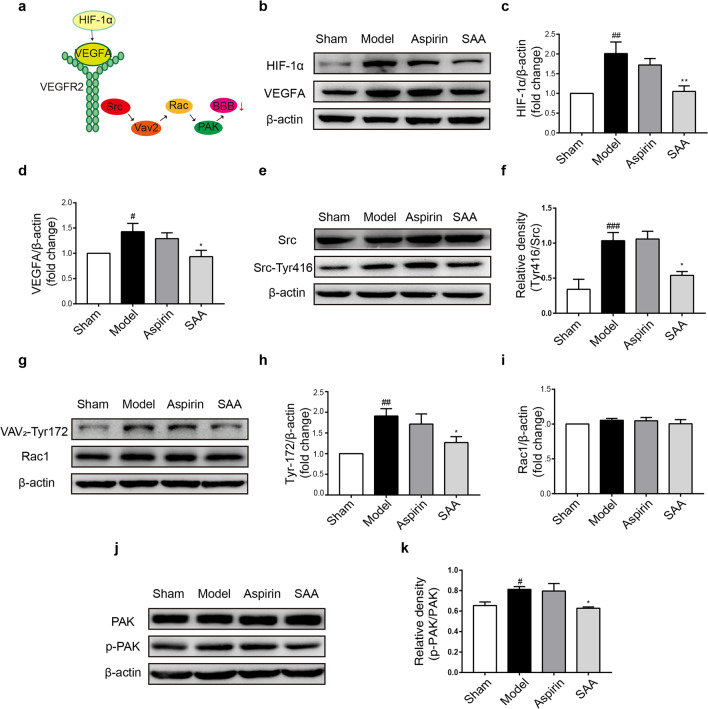
Fig. 6. SAA inhibited the activation of the VEGFA-Src signaling pathways induced by ischemic injury.
a Schematic diagram of the VEGF-Src signaling pathway. b–k Representative Western blot showing HIF-1α, VEGFA, total Src, Src-Tyr416, VAV2-Tyr172, Rac1, total PAK, and p-PAK expression. n = 6, mean ± SEM. #P < 0.05, ##P < 0.01 and ###P < 0.001 vs the sham group. *P < 0.05 and **P < 0.01 vs the model group.

