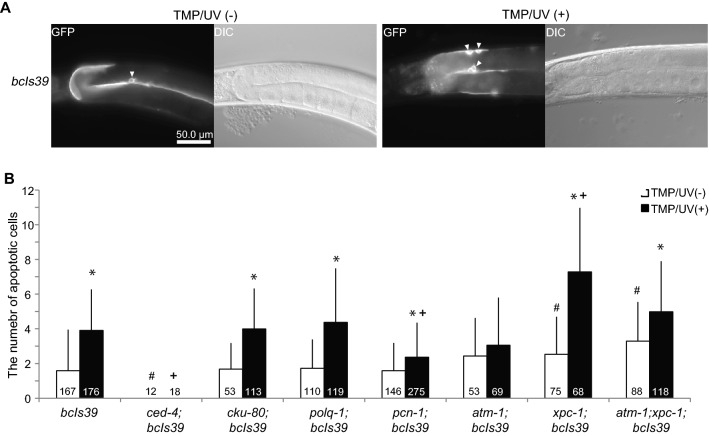
Figure 2.
Germ cell apoptosis in the TMP/UV treated DDR mutants. (A) Representative images of intact and TMP/UV treated bcls39 [CED-1::GFP]. White arrowheads indicate apoptotic cells. (B) The averaged numbers of apoptotic germ cells two hours after TMP/UV mutagenesis were shown as a bar graph. The white bars demonstrate the non-treated worms and the black bars indicate the result of TMP/UV treated worms. The error bars demonstrate the SD. All the data were tested by Steel Dwass’s Test using R software56. *p < 0.05, differences between TMP/UV(–) and TMP/UV(+) of each strain, #p < 0.05, differences between TMP/UV(−) mutants and TMP/UV(−) wild-type, + p < 0.05, difference between TMP/UV(+) mutant and TMP/UV(+) wild-type. The p-values between other pairs are summarized in Supplementary Table S3. The numbers of observed gonads are displayed on each bar.

