Figure 3.
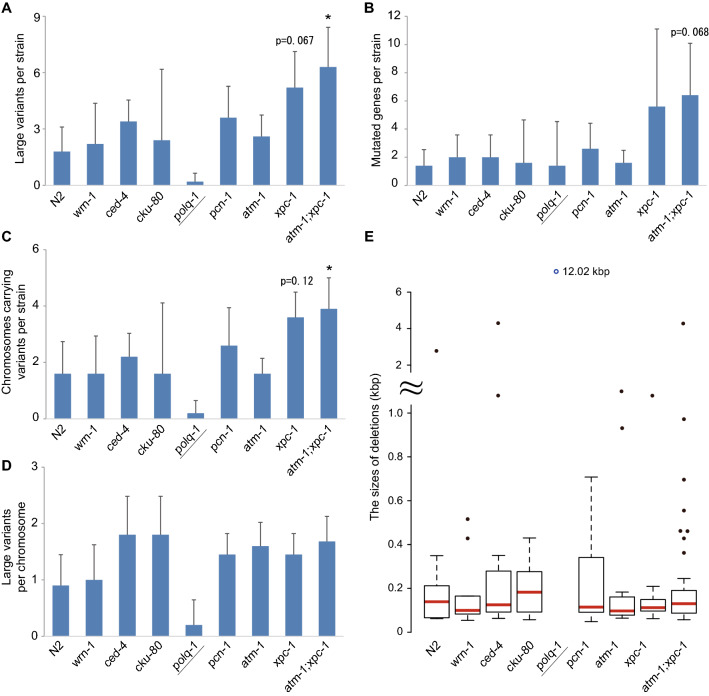
Whole genome sequencing of DDR mutants. The 5 or 10 independent lines of the TMP/UV treated N2 and DDR mutants were clonally propagated for 10 generations and the whole genome of the worms was sequenced using ionProton (Thermo Fisher Scientific). (A) The number of deletions larger than 50 bp for each strain is shown in a bar graph. Not only simple deletions but also complex deletions with insertions or inversions were counted. The polq-1 mutant shows heterozygous mutations, while the others are homozygous variants. The atm-1;xpc-1 mutant showed a significantly larger number of variants than wild-type by Steel’s test (p-value is 0.034, marked as asterisk). (B) The number of genes that were partially or completely deleted for each strain is shown in the bar graph. The atm-1;xpc-1 mutant showed not significant but the highest values (p-value is 0.068, Steel’s test). (C) The number of chromosomes carrying large variants per strain is shown in the bar graph. The atm-1;xpc-1 mutant showed a significantly larger value than wild-type by Steel’s test (p-value is 0.036, marked as asterisk). (D) The number of large variants per chromosome was shown in the bar graph. There was no significant difference between wild-type and DDR mutants by Steel’s test. (A–D) The error bars mean the SD. (E) The distribution of the deletion sizes (Supplementary Table S5). The upper panel shows larger than 1 kb and the lower panel shows less than 1 kb deletions. The variant derived from polq-1 mutant is shown as a labeled blue circle because the size of it was extremely outside the range of the other variants. The red lines and boxes indicate the median values and interquartile ranges, respectively. The whisker shows a range of 1.5 × interquartile range. There was no difference among the strains by Kruskal–Wallis rank sum test (p-value is 0.63). All statistical analyses were performed using R software56.

