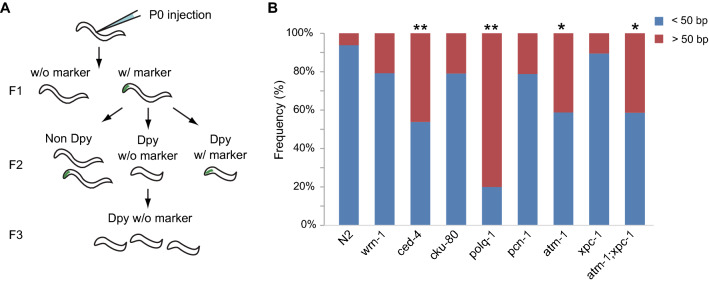
Figure 4.
The size distribution of CRISPR/Cas9-mediated deletions. (A) Overview of experimental design. Constructs for Cas-9 mediated genome editing were injected into the gonad of adult worms. Then, the F1 larvae carrying transgene were selected. From F2 progeny, we picked larvae, which show the dumpy phenotype but not the transgenic marker to eliminate worms carrying extrachromosomal array of Cas9 gene. After the confirmation that all the F3 worms showed the dumpy phenotype, the deletion sizes were confirmed by Sanger sequence. Primers used for the sequencing were designed to cover the regions from 32 kb upstream to 41 kb downstream of the dpy-3 gene (Supplementary Table S7). (B) The size of deletions was classified into two groups, larger than 50 bp (red) and less than 50 bp (blue). Then, the relative frequencies of each group were displayed as a stacked bar chart. **p < 0.01, *p < 0.05, Fisher's Exact Test. All statistical analyses were performed using R software56.

