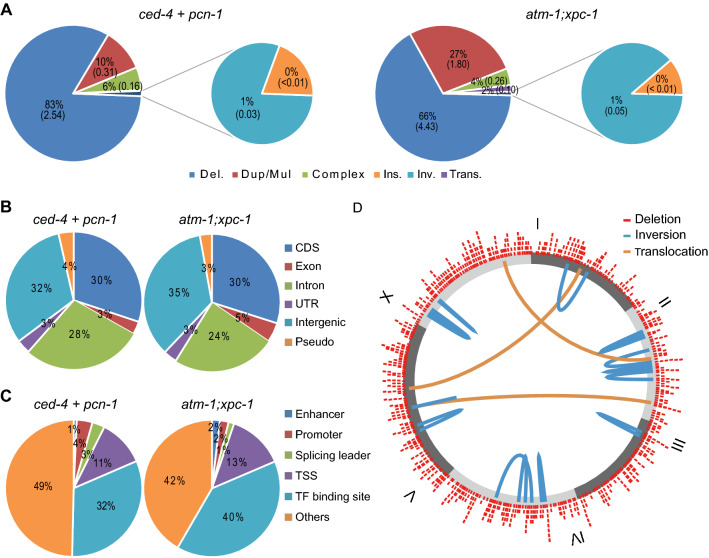
Figure 5.
Large scaled NGS. The whole genome of 10, 124, and 306 strains derived from pcn-1, ced-4, and atm-1;xpc-1 were sequenced, and homozygous variants were detected, respectively. (A) The colored pie graph shows the frequency of variants. Deletions (blue), duplications and multiplications (red), and complex deletion with insertion (green), and insertion (violet) are shown in large pie graphs, and inversions (cyan), and translocations (orange) were shown in small pie graphs. The distribution of each type of variants were different between atm-1;xpc-1 and the group of ced-4 and pcn-1 (p-value is 1.7e-4, chi-square test). (B) The variants were annotated and classified into the 6 types, CDS (blue), exon (red), intron (green), UTR (violet), intergenic region (cyan), and pseudogene (orange). There was no difference among the strains (p-value is 0.38, chi-square test). (C) The variants annotated as intergenic regions in (B) were classified into the following 6 types, enhancer (blue), promoter (red), splicing leader (green), transcription start site (TSS, violet), transcription factor (TF) binding site (cyan), and the others (orange). There was no difference among the strains (p-value is 0.18, chi-square test). (B,C) For the annotation, we used datasets obtained from WormBsae43 (WS252, ftp://ftp.wormbase.org/pub/wormbase/). (D) The positions of deletions (red) and rearranged variants were shown as a circular diagram using our script (https://github.com/YujiSue/RScript/blob/master/roundGraph.R). The break sites of 16 inversions (cyan) and 3 translocations (orange) detected from ced-4 and atm-1;xpc-1 (Supplementary Tables S5, S9) were joined by the colored curves in the circle. All statistical analyses were performed using R software56.

