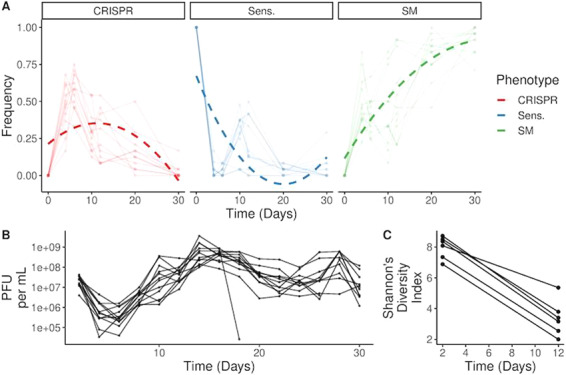
Fig. 1. Population dynamics of each bacterial genotype and phage titres.

a Each point represents the proportion of bacterial phenotypes (n = 24 clones per population) that exist in each population. Shaded lines represent individual populations. Dashed lines represent model fit from a GLM that includes a polynomial spline (knots = 2). b Lines represent the phage titres present in each population throughout the evolution experiment. c Genetic diversity (Shannon’s diversity index) of the CRISPR2 array during the first 12 days of the experiment from amplicon sequence data.
