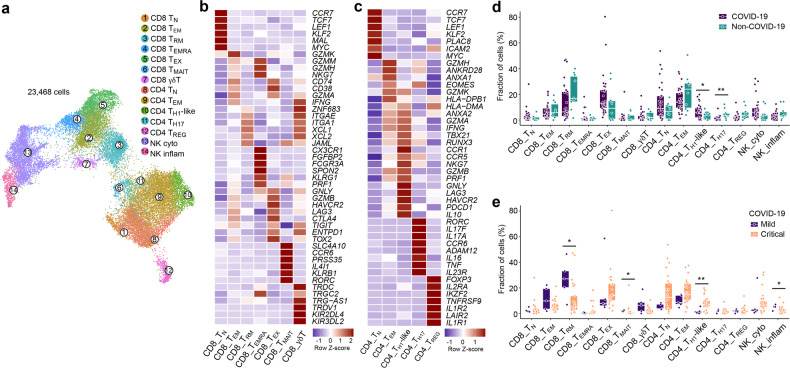
Fig. 2. 14 T-cell phenotypes in mild and critical COVID-19 BAL.
a Subclustering of 23,468 T-/NK-cells into 14 T-/NK-cell phenotypes, as indicated by the color-coded legend. NK_cyto, cytotoxic NK cell; NK_inflam, inflammatory NK cell. b, c Heatmap showing marker genes for CD8+ (b) and CD4+ (c) T-cell phenotypes. d Relative contribution of each T-/NK-cell phenotype (in %) in COVID-19 vs non-COVID-19. e Relative contribution of each T-/NK-cell phenotype (in %) in mild vs critical COVID-19. P values were assessed by Mann–Whitney test. *P < 0.05, **P < 0.01, ***P < 0.001.

