Fig. 1.
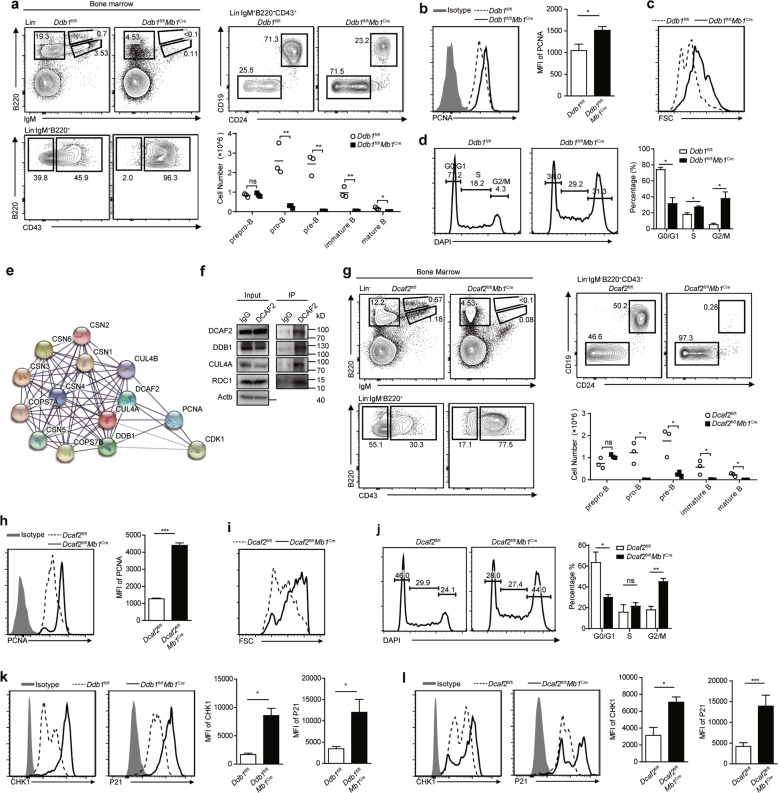
The DDB1-DCAF2 complex is required for B cell development because it controls cell cycle progression. a Prepro-B (Lin−IgM−B220+CD43+CD24−CD19−), pro-B (Lin−IgM−B220+CD43+CD24+CD19+), pre-B (Lin−IgM−B220+CD43−), immature B (Lin−IgM+B220low), and mature B (Lin−IgM+B220hi) cells from the indicated mice were analyzed by flow cytometry (n = 3). The absolute numbers of B cells at different stages are shown in the column chart. b PCNA staining of pro-B cells. MFI of PCNA is shown on the right. c The size of pro-B cells from the indicated mice. d Cell cycle analysis of pro-B cells by DAPI staining. The percentage of each cell phase is shown on the right. e Ba/F3 cells expressing Flag or Flag-DCAF2 were subjected to immunoprecipitation, and proteins that were pulled down were identified by mass spectrometry. A protein-protein interaction network was generated with the identified proteins by using the STRING database (https://string-db.org). f Coimmunoprecipitation of CUL4A, DDB1 and ROC1 with DCAF2 in Ba/F3 cells. Each experiment was independently repeated at least three times. g Flow cytometry analysis of B cell subsets in the bone marrow from the indicated mice (n = 3). The absolute numbers of B cells at different stages are shown in the column chart. h PCNA staining of pro-B cells from wild-type and DCAF2-deficient mice. MFI of PCNA is shown on the right (n = 3). i The size of pro-B cells was determined by forward scatter (FSC) signals. j Cell cycle analysis of pro-B cells of the indicated genotypes by DAPI staining. The percentage of each cell phase is shown on the right. k The protein levels of CHK1 and P21 in pro-B cells from DDB1-deficient mice and wild-type littermates were analyzed by flow cytometry. MFI of each protein was determined and is shown on the right (n = 3). l The protein levels of CHK1 and P21 in pro-B cells from DCAF2-deficient mice and wild-type littermates were analyzed by flow cytometry. MFI of each protein was determined and is shown on the right (n = 3). Bars represent the mean ± SD. Data are representative of at least three independent experiments. Statistical analysis was performed using two-tailed, unpaired Student’s t test. NS, not significant, *P < 0.05, **P < 0.01, ***P < 0.001

