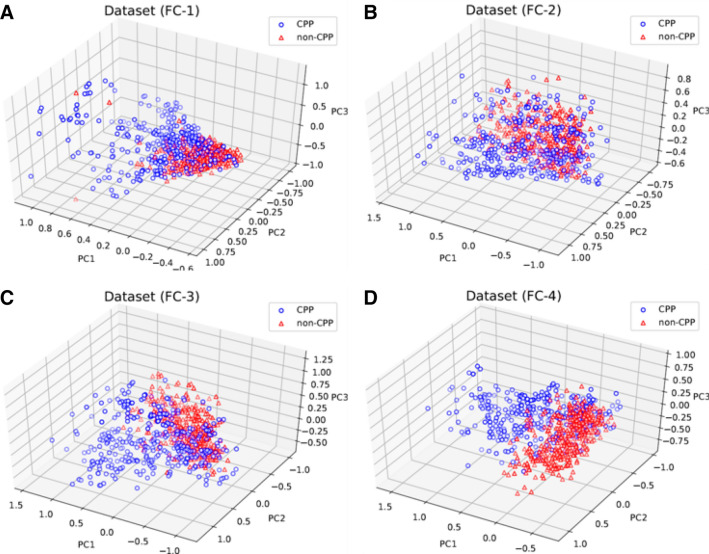
Figure 6.
Analysis of 3D dimensionality reduction using PCA of the sequence- and structure-based descriptors present in FC-1 to FC-4. Panel (A) 3D PCA of FC-1 showing a contribution of explained variance ratio of 10.93% (PC1), 7.26% (PC2), and 6% (PC3), and cumulative explained variance ratio (CEVR) of 24.19%. (B) 3D PCA of FC-2 showing a contribution of explained variance ratio of 48.9% (PC1), 21.94% (PC2), and 14.34%(PC3), and CEVR = 85.19%. (C) 3D PCA of FC-3 showing a contribution of explained variance ratio of 16.31% (PC1), 12.03% (PC2), and 7.22% (PC3) and CEVR = 35.58%. (D) 3D PCA of FC-4 showing a contribution of explained variance ratio of 17.81% (PC1), 12.48% (PC2), and 8.93% (PC3), and CEVR = 39.29%.

