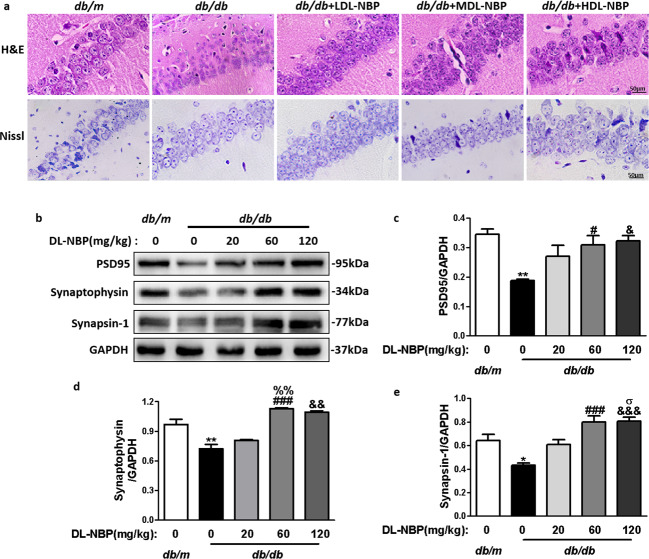
Fig. 2. DL-NBP attenuates diabetes-induced morphological alterations and synaptic dysfunction in DACD.
a Representative H&E and Nissl stained sections of the CA1 region in the hippocampus. Scale bar = 50 μm, n = 5. b Representative Western blots showing PSD95, synaptophysin and synapsin-1 expression levels. c–e Quantitative analysis of PSD95, synaptophysin and synapsin-1 expression levels, n = 3. *P < 0.05, **P < 0.01 indicates db/m group vs. db/db group; #P < 0.05, ###P < 0.001 indicates db/db+MDL-NBP group vs. db/db group; &P < 0.05, &&P < 0.01, &&&P < 0.001 indicates db/db+HDL-NBP group vs. db/db group; %%P < 0.01 indicates db/db+MDL-NBP group vs. db/db+LDL-NBP group; σP < 0.05 indicates db/db+HDL-NBP group vs. db/db+LDL-NBP group.

