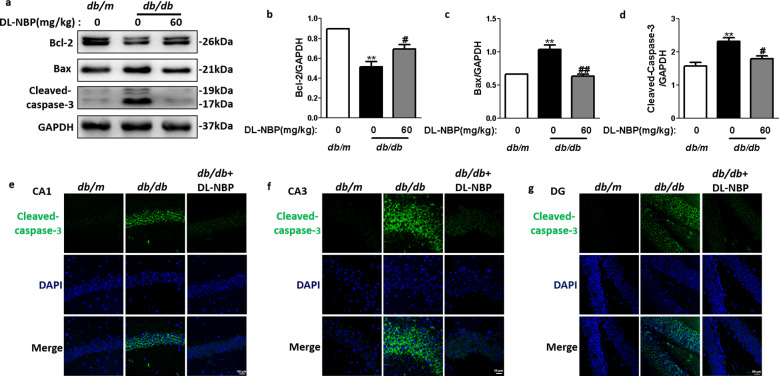
Fig. 4. DL-NBP reduces neuronal apoptosis in the hippocampus of db/db mice.
a Western blot quantification of Bcl-2, Bax and Cleaved-caspase-3 expression. b–d Quantitative analysis of Bcl-2, Bax and Cleaved-caspase-3 expression, n = 3. e–g Immunofluorescence staining of Cleaved-caspase-3 in the CA1 (e), CA3 (f) and DG (g) regions of the hippocampus. Scale bar = 50 μm, n = 5. **P < 0.01 indicates db/m group vs. db/db group; #P < 0.05, ##P < 0.01 indicates db/db group vs. DL-NBP+db/db group.

