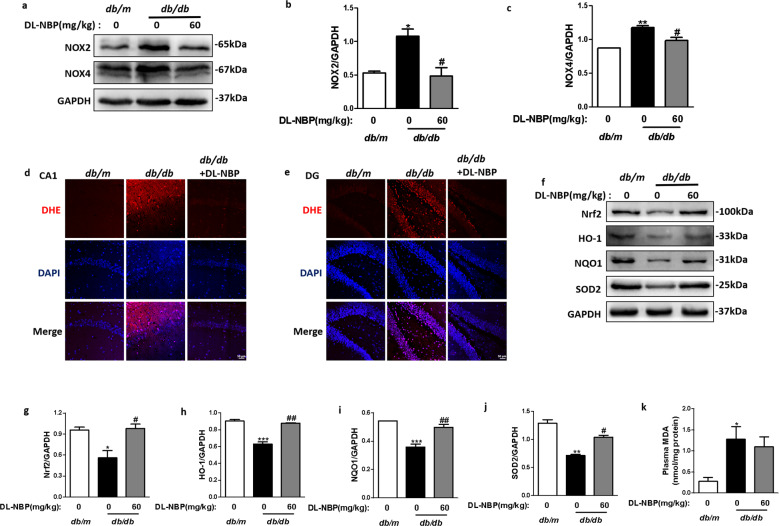
Fig. 5. DL-NBP attenuates diabetes-induced oxidative stress in the hippocampus.
a Western blot quantification of NOX2 and NOX4 expression. b and c Quantitative analysis of NOX2 and NOX4 expression, n = 3. d and e Representative images of DHE staining of the CA1 (d) and DG (e) regions of the hippocampus. Scale bar = 50 μm, n = 5. f Western blot quantification of Nrf2, HO-1, NQO1 and SOD2 expression. g–j Quantitative analysis of Nrf2, HO-1, NQO1 and SOD2 expression, n = 3. k Plasma MDA content in the different groups. n = 4. *P < 0.05, **P < 0.01, ***P < 0.001 indicates db/m group vs. db/db group; #P < 0.05, ##P < 0.01 db/db group vs. DL-NBP+db/db group.

