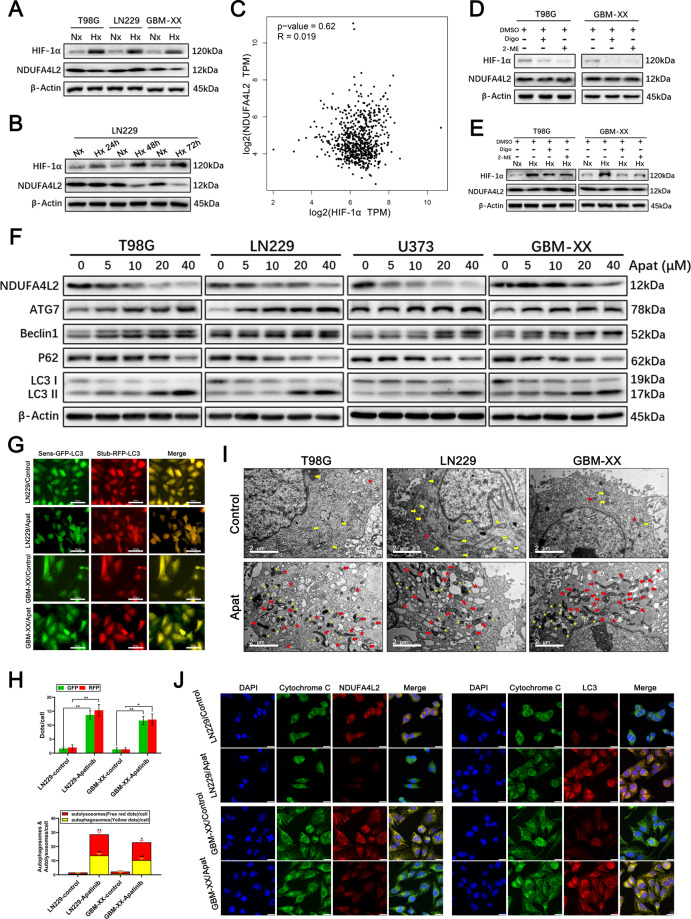
Fig. 4. NDUFA4L2 is not regulated by HIF-1α in GBM and Apatinib effectively inhibits NDUFA4L2 expression and induces autophagy in GBM cells.
A Immunoblot analysis of HIF-1α and NDUFA4L2 protein levels in T98G, LN229, and GBM-XX cells cultured under normoxic or hypoxic conditions (1% O2 for cell cultures). B Immunoblot analysis of HIF-1α and NDUFA4L2 protein levels in LN229 cells cultured under normoxia or hypoxia for 24, 48, and 72 h. C Based on TCGA data, the correlation between the expression levels of HIF-1α and NDUFA4L2 in patients with glioma was analyzed using the Pearson method. D Protein levels of HIF-1α and NDUFA4L2 in T98G and GBM-XX cells cultured under normoxia with digoxin (100 nM) or 2-ME (10 μM) were determined by western blotting. E Protein levels of HIF-1α and NDUFA4L2 in T98G and GBM-XX cells cultured under hypoxia (24 h) with digoxin or 2-ME were determined by western blotting. The images shown are representative of three experiments. F Immunoblot analysis of NDUFA4L2, LC3, p62, Beclin-1, and ATG7 protein levels in T98G, LN229, U373, and GBM-XX cells following treatment with apatinib (0, 5, 10, 20, and 40 μM). G, H Apatinib-treated LN229 and GBM-XX cells that stably express the stubRFP-sensGFP-LC3 fusion protein were observed by fluorescence microscopy. I Representative transmission electron microscopy images of T98G, LN229, and GBM-XX cells following treatment with apatinib (20 μM). J Immunofluorescence images of apatinib-treated LN229 or GBM-XX cells showing DAPI (blue), cytochrome C (green), and NDUFA4L2 or LC3 (red) staining, as well as merged images of the three signals. The images shown are representative of three experiments.

