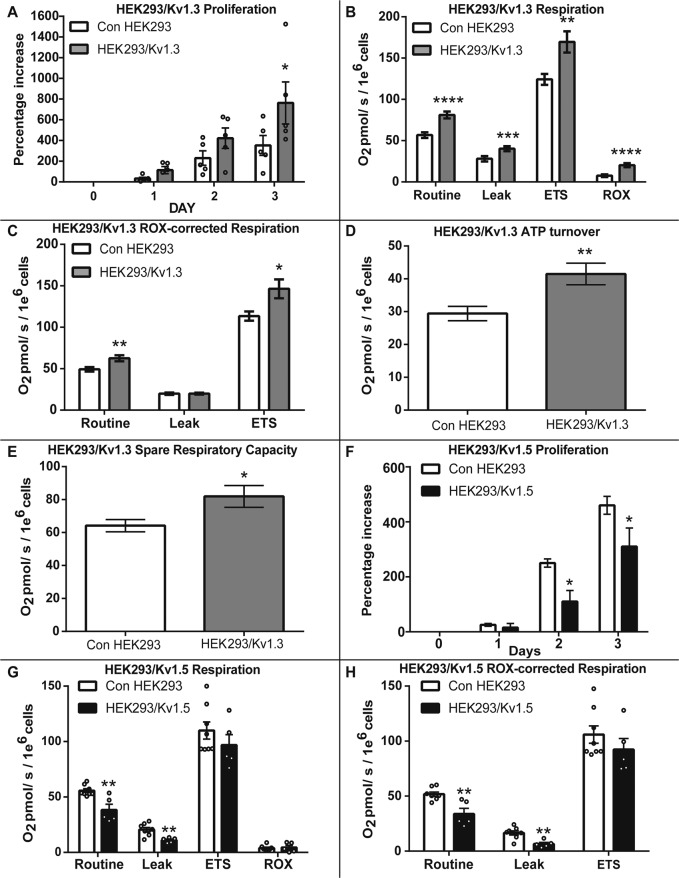
Fig. 1. Kv1.3 expression increases cellular proliferation and respiration.
A HEK293/Kv1.3 cells exhibit enhanced proliferation compared with control HEK293 cells. The percentage increase in cell number over 3 days normalised to day 0 (n = 5). B Routine, Leak, maximal electron transfer system (ETS) and residual (ROX) O2 consumption in HEK293/Kv1.3 (n = 38) and control HEK293 (n = 27) cells measured by high-resolution respirometry. C ROX-corrected Routine, Leak and ETS O2 consumption in HEK293/Kv1.3 (n = 38) and control HEK293 (n = 27) cells measured by high-resolution respirometry. D ATP turnover in HEK293/Kv1.3 (n = 38) cells and control HEK293 (n = 27) cells. E Spare respiratory capacity in HEK293/Kv1.3 (n = 38) and control HEK293 (n = 27) cells. F Proliferation is suppressed in HEK293/Kv1.5 cells (n = 12) compared with control HEK293 (n = 15). Percentage increase in cell number at day 1, 2 and 3 from day 0. G Routine, Leak, ETS and ROX O2 consumption in HEK293/Kv1.5 (n = 5) and control HEK293 (n = 8) cells measured by high-resolution respirometry. H ROX-corrected Routine, Leak, and ETS O2 consumption in HEK293/Kv1.5 (n = 5) and control HEK293 (n = 8) cells measured by high-resolution respirometry. Data expressed as the mean ± SEM. Data were analysed using either Student’s t-test or two-way ANOVA. *p < 0.05, **p < 0.01, ***p < 0.001 and ****p < 0.0001.

